Modern marketing is impossible without analytics: budgets are increasing, and requirements for return on investment are becoming increasingly stringent. However, not every advertisement guarantees a profit—some of the funds inevitably disappear into thin air, without paying for themselves at all.
Without clear metrics, it is difficult to understand which investments really work and which only create the appearance of effectiveness. Marketers have a variety of metrics at their disposal for evaluating the profitability of marketing strategies.
Among them, ROAS (return on advertising spend) is particularly important. It is indispensable when preparing reports and planning spending for the next period. In this article, we will look at how to measure the return on advertising investments and what business tasks ROAS can be used to solve.
What is ROAS in advertising?
Return on Advertising Spend is a marketing metric that measures the profit from a marketing campaign relative to its cost. Literally, the term translates as “return on advertising spend.” Simply put, ROAS is the answer to the question: how many hryvnias did each hryvnia invested in promotion bring in?
Metrics are used to evaluate any marketing activities: contextual advertising on Google, targeting on social networks, banner placement, and even SEO promotion. Wherever there are costs associated with attracting an audience, it is possible and necessary to calculate the return on investment in advertising.
Of course, many marketers are accustomed to using ROI as their primary metric for evaluating the return on investment in a business. But there is a fundamental difference: ROI evaluates the effectiveness of investments as a whole, while ROAS focuses exclusively on advertising. For example, if you invested $50,000 in promotion and want to understand how much money you got back, calculate your ROAS.
The result of the calculation is usually expressed as a percentage or ratio. For example, a ratio of 1:5 means that every hryvnia invested brought in 5 hryvnias. If you spent 10,000 UAH and received 50,000 UAH, the ratio is 500% or 1:5.
How to use ROAS in practice? Let’s say you launched two campaigns: one on Google Ads and the other on Facebook. In the first case, the indicator was 300%, and in the second, 180%. The logical conclusion: it makes sense to increase investment in Google and review the settings on Facebook or abandon it altogether.
Why calculate ROAS?
Metrics such as CTR, impressions, or traffic volume provide an understanding of quantitative results. But they don’t answer the main question: are you making money on a particular advertising campaign or losing money? ROAS allows you to evaluate the return on investment of advertising in monetary terms and understand the real economic effectiveness of your marketing efforts.
Imagine this situation: two campaigns bring in the same number of conversions. They seem to be equal in value. But you spent $5,000 on the first one, and it brought in $25,000, while the second one cost $15,000 and brought in the same $25,000 in revenue. Without calculating ROAS, you wouldn’t notice that the second campaign is three times less effective.
This indicator will also help with the following tasks:
- Overall effectiveness assessment. You can immediately see whether advertising is profitable or not. If ROAS drops, it’s a signal for immediate optimization.
- Calculating the optimal budget. Knowing the current ROAS, you can predict how much you need to invest to achieve your goals or simply the desired level of return on investment.
- Comparing different traffic channels with each other. Context versus targeting, Google versus Facebook — ROAS provides a quick answer without the need to compile complex financial reports.
- Eliminating unprofitable combinations. When you see that a particular advertising creative or audience is generating a low ROAS, you can quickly redirect your funds to more profitable areas.
- Competitive analysis. By comparing your values with market averages, you can identify weaknesses in your strategy and areas for growth.
- Making decisions about scaling. Increasing the budget only makes sense for campaigns with high ROAS — this decision is based on actual revenue, not abstract clicks.
For example, you are running a marketing campaign for an online store and testing placement on Google Shopping. It shows a ROAS of 450%. At the same time, the target on Instagram has a rate of 280%, and banner advertising on a thematic website has a rate of 120%. The conclusion is obvious: we allocate most of the funds to Google Shopping, optimize Instagram, and most likely abandon banners.
What are the advantages of ROAS?
ROAS stands out from other metrics in internet marketing due to:
- Simplicity of calculation. You don’t need complex financial models or special knowledge in analytics. The formula is elementary, and the result gives a clear answer to the question of investment efficiency. This speed of assessment saves time and money. Let’s say you’ve launched five different ads. In just a week, you can calculate the ROAS for each one and immediately disable those that are dragging the campaign into the red. Redirect the freed-up funds to the leaders, and your advertising will start to bring in more at the same cost.
- Versatility of application. The metric is equally useful for a local coffee shop that promotes itself on Instagram and for a large marketplace with millions spent on context. The principle remains the same: you spent X dollars and earned Y dollars. The only difference is in the scale of the numbers, but the logic of the analysis remains the same. This makes ROAS a basic tool in the arsenal of any marketer, regardless of the size of their business or niche.
- Clarity. ROAS is expressed in specific figures — percentages or ratios. You don’t have to interpret abstract graphs; you see a clear answer: you invested $1 and got $5 back. This simplifies communication with management or clients. When you need to explain why you need to increase the budget for a particular channel, the conditional 500% speaks for itself — no long presentations or complicated explanations required.
- Versatility. Metrics can be calculated at any level of detail: for the entire promotion strategy, a specific ad, or even a single keyword. For example, you launched an ad campaign in Google Ads with ten ad groups. ROAS allows you to evaluate the effectiveness of each group separately and find those that are dragging down the overall result.
- Quick decision-making. Unlike metrics that require data to be collected over a long period of time, ROAS can be tracked in real time. If you notice a drop in numbers in the middle of the week, make adjustments to your settings immediately, without waiting until the end of the month and wasting money.
- Direct link to business goals. Clicks and impressions are intermediate metrics. ROAS, on the other hand, is directly linked to revenue, which is why businesses run ads in the first place. This makes the conversation between the marketer and the business owner more meaningful: you’re not discussing abstract traffic, but real money.
Are there any drawbacks to this method?
Despite all its advantages, ROAS has not become the ideal metric for measuring effectiveness. It is important to remember that this indicator:
- It only takes direct income into account. ROAS completely ignores operating costs: logistics, packaging, service, payment system commissions. Let’s say you sell a product for 1,000 UAH, and your ROAS is 400%. Looks great. But if the cost of the goods is $600, plus delivery costs of $100, the actual profit will be much lower than it seemed at first glance.
- It does not take into account lifetime value (LTV). ROAS only records the first purchase, even though a person may return again and again. For example, you attracted a buyer through advertising for $200, and they placed an order for $500. ROAS is 250%, which seems pretty good. But if this customer makes five more purchases over the course of a year for a total of $15,000, the short-term report will greatly underestimate the real return.
- It distorts the picture in multi-channel situations. When a customer has several points of contact with a business before making a purchase, ROAS can be misleading. A typical situation: a person saw a banner on Google, then received an email newsletter, then clicked on a remarketing ad, and only then placed an order. Which channel should be credited with the conversion? A standard ROAS calculation will attribute all revenue to the last click, even though it was actually a combination of factors that worked.
ROAS calculation formula
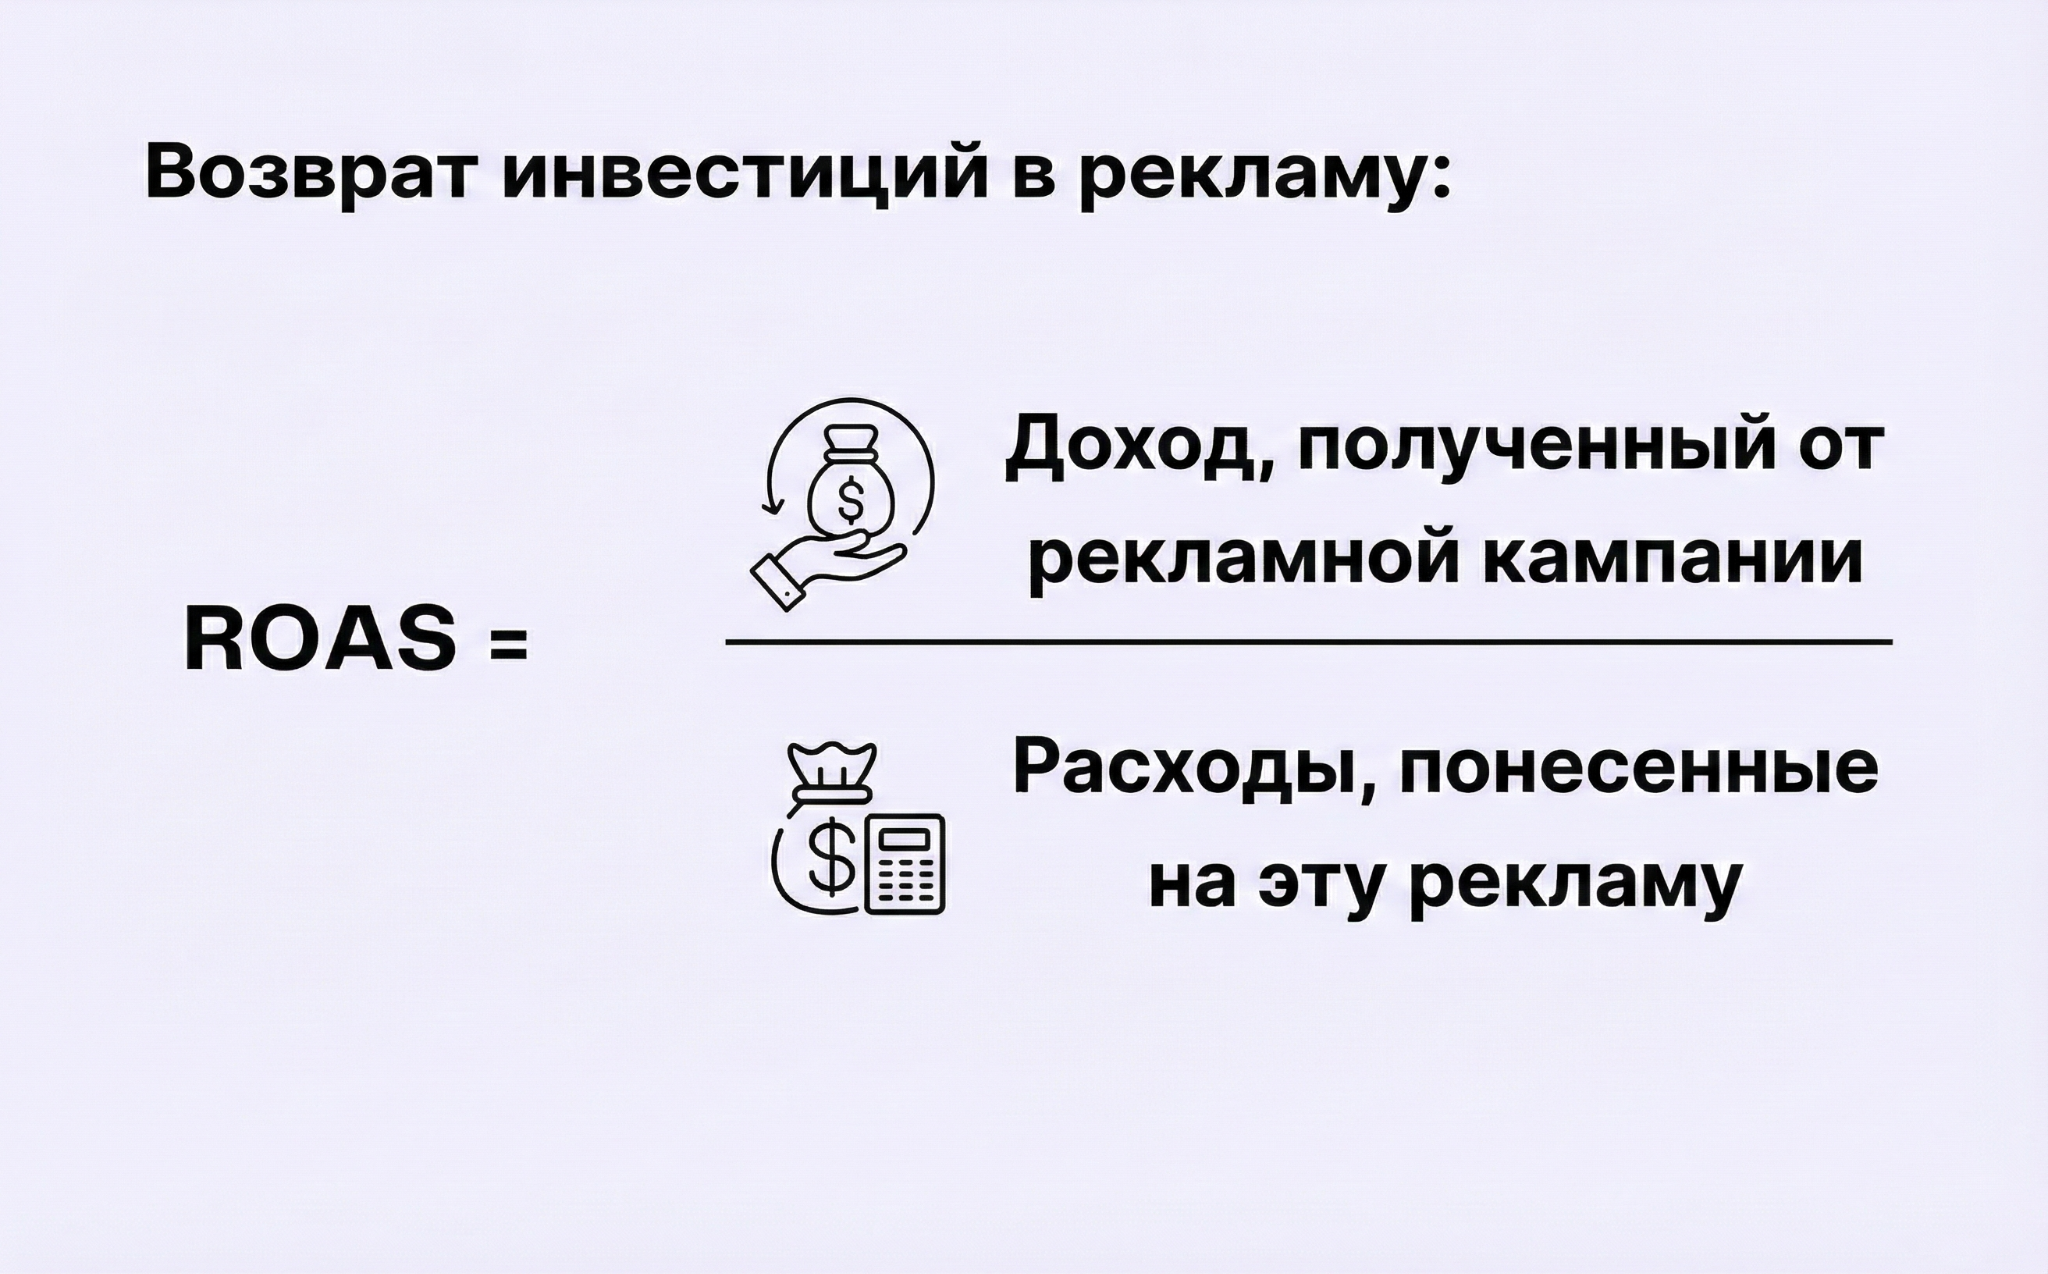
The ROAS formula is extremely simple:
ROAS = (Advertising revenue / Advertising costs) × 100%
Where:
- Advertising revenue — all funds you have received thanks to advertising activities.
- Advertising costs — the amount spent on promotion: contextual advertising, social media targeting, banner placements, and other paid channels.
To calculate ROAS, you only need two figures. Expenses are straightforward—they are recorded in online accounts. However, revenue is more complicated. You need to know exactly how many people came from advertising and how much they spent on goods.
If you ask sales managers for this data, you will inevitably lose part of your audience, and the result will be inaccurate. It is much better to use automated data collection: set up tracking in your advertising account and install an analytics system such as Google Analytics or Clarity from Microsoft.
Tip! If you don’t want to calculate ROAS manually, use our convenient contextual advertising calculator.
Let’s say you launched an advertising campaign for an online electronics store. You spent $50,000, and sales from this advertising amounted to $200,000.
ROAS = (200,000 ÷ 50,000) × 100% = 400%
This means that every hryvnia invested generated 4 hryvnia in revenue. The result can also be expressed as a ratio of 1:4.
Calculate ROAS separately for each traffic source, campaign, ad group, and even individual ad objects. Usually, the indicator is calculated for the entire campaign period, but you can also analyze individual intervals—a week or a month. This helps you notice a drop in effectiveness in time and adjust the settings.
Important: the calculation uses revenue — the total amount from sales. Do not confuse this with profit, which is calculated using the formula “revenue minus cost.” If you substitute profit for revenue in the formula, the result will be distorted.
What ROAS is considered good?
The basic principle of assessment can be formulated as follows:
- ROAS < 100% — advertising costs exceed revenue, investments are unprofitable.
- ROAS = 100% — expenses equal income, no profit.
- ROAS > 100% — advertising pays for itself and generates revenue.
The answer would seem obvious: a good indicator should be above 100%. But calculating ROAS in isolation from business margins is a mistake that can prove costly.
Let’s look at an example. You spent $600 and earned $1,500. Your ROAS was 250% — which seems like a great result. But if your product margin is only 15%, the picture changes dramatically. From your $1,500 in revenue, you will only earn $225 in gross profit. And you spent $600 on advertising. The result: a real loss of $375.
To break even with such a margin, ROAS must be at least 667%. That is, every hryvnia invested must yield a return of almost 7. In reality, such indicators are rare.
According to research, the average ROAS, regardless of niche, is around 287% (a ratio of 1:2.87). At the same time, in e-commerce, it can reach 400%, and for offline sales, it is worth aiming for a ROAS of at least 1:3 — after all, the cost of attracting a buyer is too high.
But for a streaming service, the same 1:2 ratio is quite a decent result. Why? Because the attracted customer signs up for a subscription and pays monthly. The high costs of initial acquisition are offset by repeat payments.
Below are approximate values for different niches:
- E-commerce (goods) — 1:3–1:4. This is the classic break-even point for online stores. Below this, there is a risk of breaking even or operating at a loss.
- B2B and services — 1:5 and above. The transaction cycle is longer, the cost of a lead is higher, but the average check is usually significantly larger.
- Info products — 1:2–1:3. Digital goods have high margins, so you can work with a more modest ROAS and still remain in the black.
Why is it more difficult to calculate the return on investment in advertising for the B2B sector?

The return on investment in advertising in the B2B segment is more difficult to calculate than in B2C. And it’s not because the formula is complicated — it’s the same. The problem lies in the specifics of the sales themselves:
- Long transaction cycle. If a customer buys a product from an online store an hour after clicking on an ad, in B2B the path from initial contact to signing a contract can take months or even years. Let’s say you sell industrial equipment. A potential customer clicked on an ad in March, requested a commercial offer, agreed on a budget with management, conducted a tender, and only made the purchase in November. Which advertising period should this sale be counted towards? You have to take into account long-term marketing costs and forecast revenue for the entire cycle.
- High transaction costs. A single B2B contract can cost hundreds of thousands of hryvnia. This means that even a single conversion has a significant impact on ROAS. If you attract two customers instead of one, the indicator doubles. If you lose one, it falls by half. Such volatility complicates analysis and requires long-term assessment.
- Collective decision-making. In B2C, the purchase decision is made by the person who clicked on the ad. In B2B, it’s different: the manager saw the ad, passed the information on to the CEO, who discussed it with the CFO, and the final decision was made by the owner. Which of them is your target audience? All points of contact are important, but it is extremely difficult to track their impact on the final deal.
- The value of leads, not just sales. In B2B, not every lead turns into a customer right away. But that doesn’t mean it’s useless — maybe the deal will happen in six months. That’s why ROAS takes into account not only actual conversions, but also the cost of attracting potential customers. This makes the formula less accurate, but more realistic for the specifics of the segment.
How can you increase the return on investment of advertising?
If your calculations show a low ROAS, don’t rush to get rid of individual promotion methods. First, make sure you’ve accounted for all sales — sometimes some of them get lost due to incorrect analytics settings. If the data is correct, try to improve your advertising ROI using the following methods.
Optimize advertising campaigns

Start with a thorough analysis of your reports. Study statistics by device, region, time of day, and individual creatives to identify bottlenecks. For example, you may find that your ads perform well on desktop but poorly on mobile devices. Or that users from Kyiv convert three times better than those from other regions.
Disable combinations where the metric is consistently below the profitability threshold. Redirect the freed-up funds to combinations with positive dynamics. At the same time, test new hypotheses: alternative headlines, other banner formats, new audience segments.
But keep an eye on traffic volume and statistical significance—don’t make decisions based on random spikes. Redistribute money gradually, based on data from 2–3 full cycles, rather than on a few lucky days.
By the way, you can learn how to set ROAS in Google Performance Max advertising from Yana Lyashenko’s new video:
Implement A/B testing
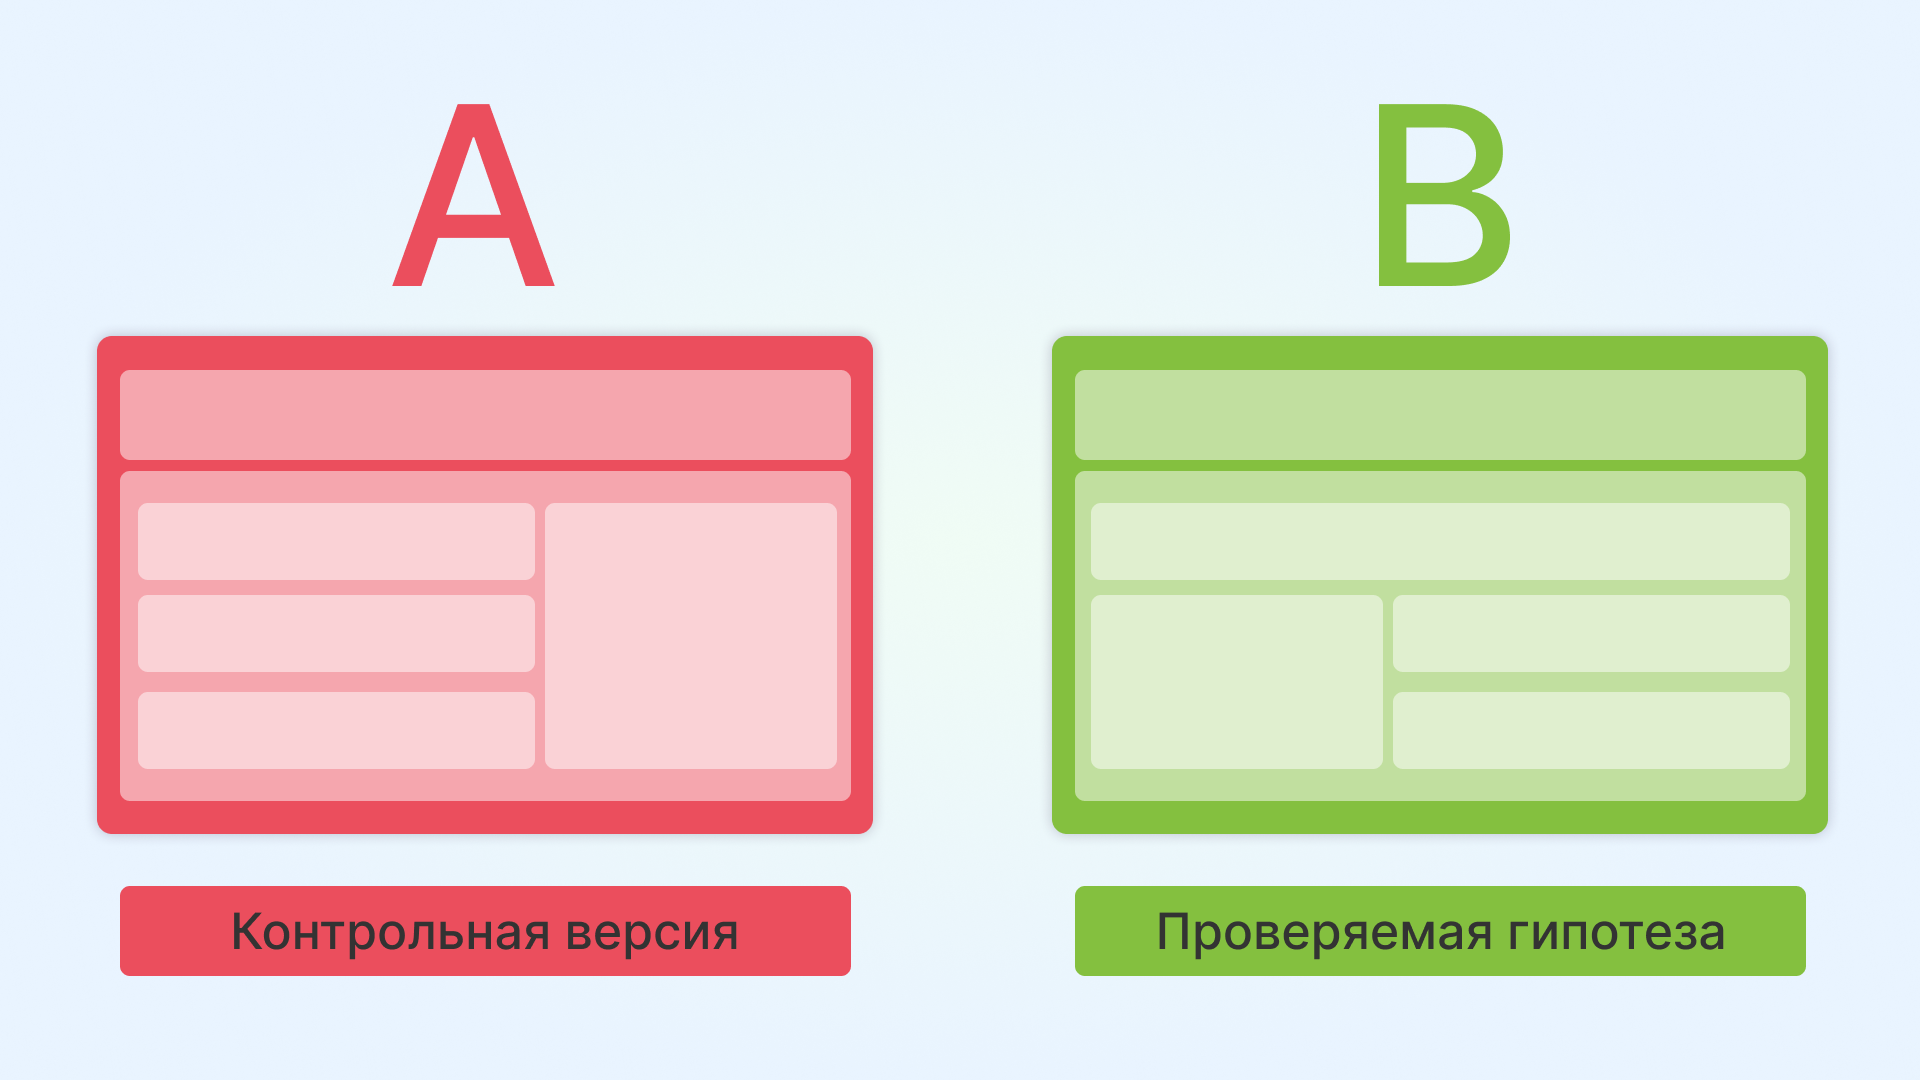
Such tests help find combinations that actually increase advertising performance. The algorithm is as follows:
- Prepare several versions of advertisements with different headlines, calls to action, and visual designs.
- Launch them on small budgets — enough to gather statistics;
- Select winners and scale results.
An important rule: change only one element per test. If you change the headline, image, and button at the same time, you won’t understand what exactly affected the final value of the indicator.
Keep an eye on the sample size. If the traffic is too low, the final numbers will be random. Aim for at least 100–200 target actions in each variant. Use Google Optimize or your CRM’s built-in tools to conduct tests.
And most importantly, interpret the results correctly. An increase in the number of purchases should be confirmed by statistical significance, not just a single successful day. Only then should you adopt the new version as working and move on to the next hypothesis. This consistent approach ensures stable ROAS growth without sharp fluctuations in your budget.
Set up remarketing for warm audiences
It is always cheaper to retain an existing customer than to find a new one. If a certain segment of your audience has already provided a high return on investment, focus on motivating these people to make repeat purchases.
What tools work best for this? Personalized discounts with a limited time frame. They emphasize the value of the customer and create a sense of urgency. For example, a letter saying “Just for you: 15% off your next order until the end of the week” converts much better than an impersonal mass mailing.
Pay special attention to users who started a targeted action but didn’t finish it. They abandoned their cart, filled out half of the application, spent a long time studying the product page — all of these are signs of interest. Set up retargeting for this audience and show personalized ads: reminders about unfinished purchases bring back a significant portion of potential customers.
To bring back your audience, use all available options: email chains, push notifications, messages in messengers — if the platform’s policy allows it.
Carefully segment your target audience
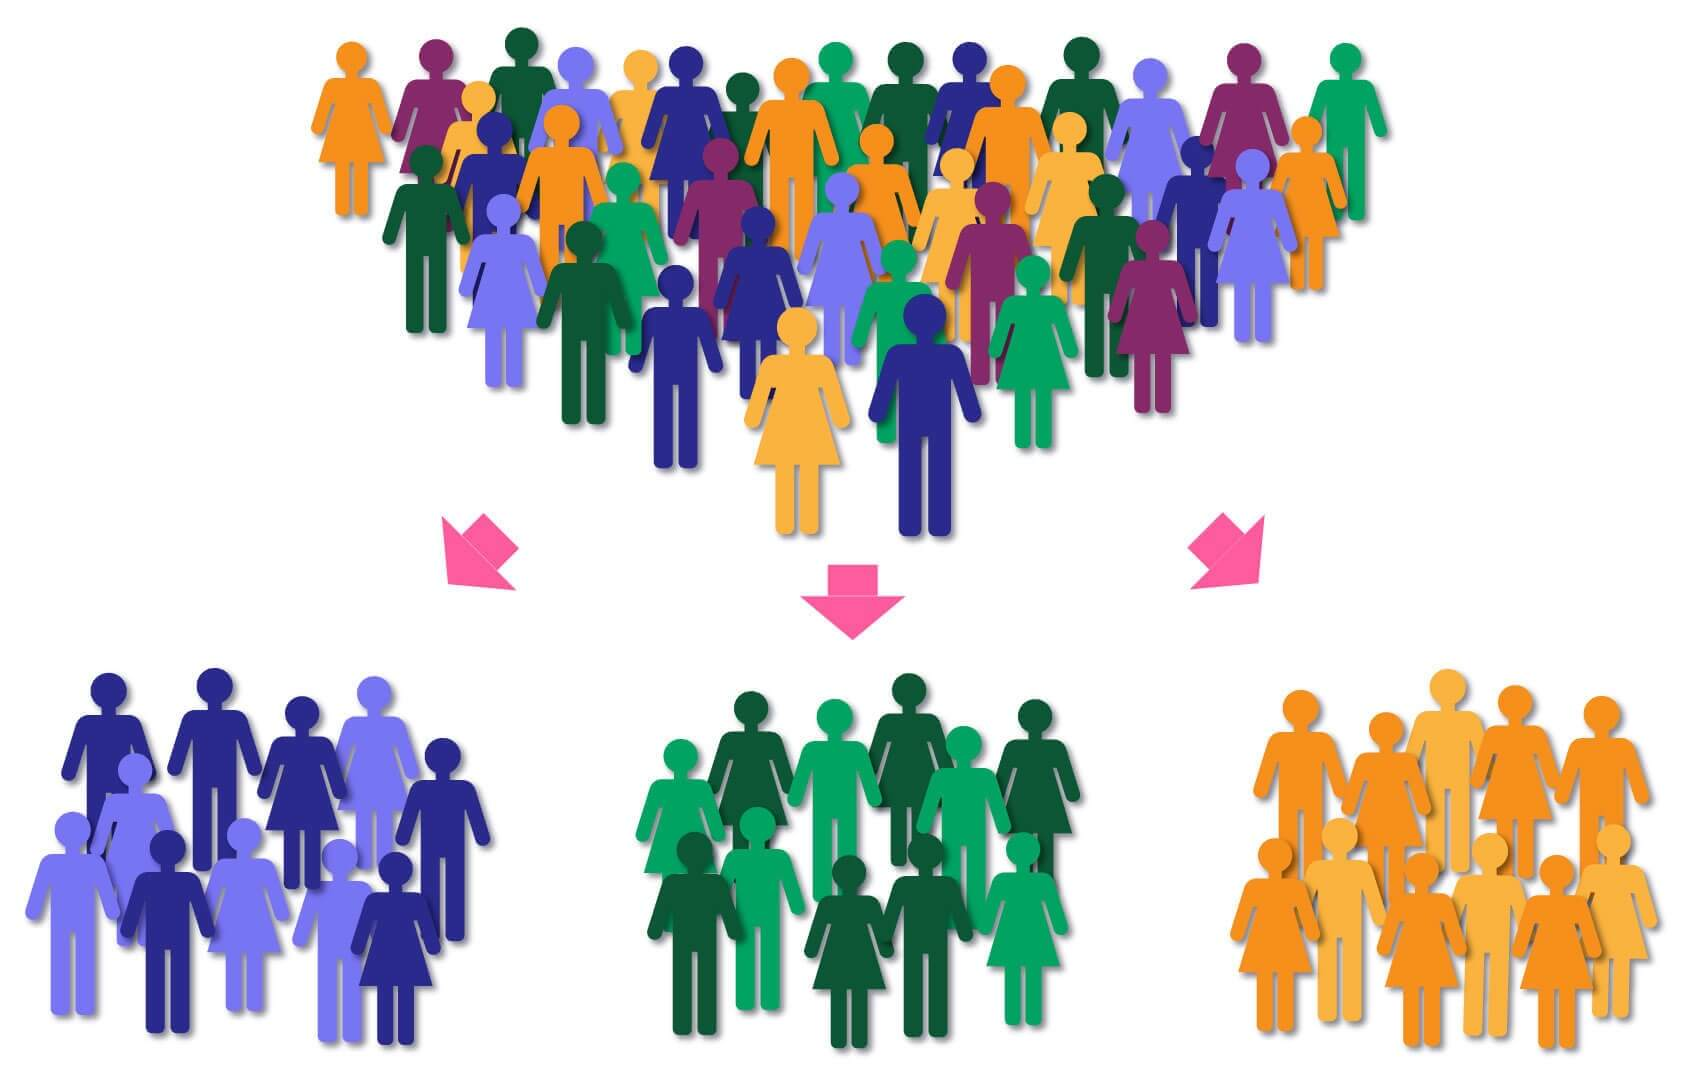
Everywhere—in context, social media targeting, SEO—divide your audience into groups based on meaningful characteristics. This will allow you to create targeted offers that meet the needs of a specific segment.
How to do this in practice:
- Analyze your current audience—who these people are, where they come from, what they buy.
- Create a customer profile for each segment: age, interests, website behavior, funnel stage.
- Write down the segments and note their differences.
- Use this knowledge when developing advertisements—each segment has its own message.
For example, show new visitors an introductory offer, and those who have already made a purchase an offer from the “You may also like” category. Give mobile users a short call to action, and desktop users more detailed information.
Poor targeting can kill even the most successful offer. People see messages that are irrelevant to them and simply scroll past them. Money is wasted. That’s why thoughtful segmentation is not an option, but a necessity for stable return on investment.
Work on improving landing pages
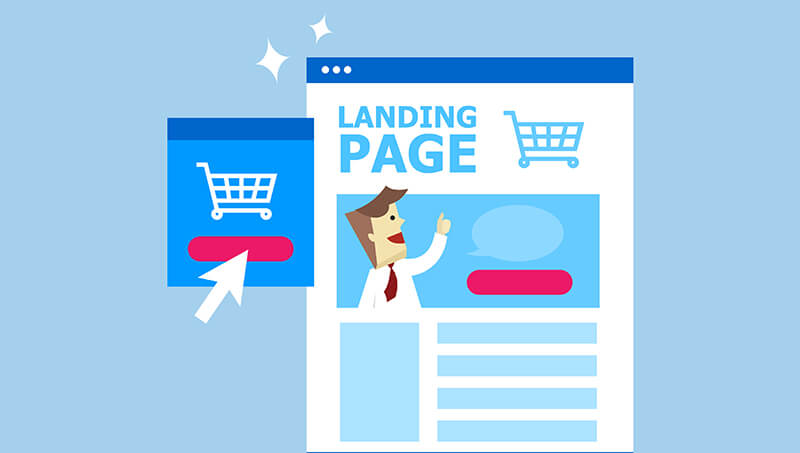
The website or landing page linked to from an ad must clearly convey your unique selling proposition. Even if you attract high-quality traffic, a weak landing page will minimize potential purchases.
Start with a critical assessment of the current state: review the offer, check the texts for errors, evaluate the design through the eyes of a new visitor. A useful tool is a heat map of clicks. It will show where users look first, which elements they ignore, and where they “get stuck.” This data will help you formulate hypotheses for improving performance.
What specifically to check and improve:
- The first screen is crucial. You have about three seconds to keep the visitor engaged. The headline must accurately reflect the promise—any discrepancy will cause mistrust. Here, you should also include a brief description of the benefits and a visual emphasis on the target action.
- Loading speed. Every additional second of waiting reduces conversion by 3–10%. Check the speed using Core Web Vitals, optimize images, and remove heavy scripts.
- Mobile adaptation. Up to 70% of traffic comes from smartphones. The page should display correctly on any device, and buttons and form fields should be easy to press with a finger.
- Visual clarity. Contrasting CTA buttons, readable fonts, no pop-ups in the first few seconds. Remove unnecessary fields from the application form — each additional step cuts off a portion of potential customers.
Track conversions at every step of the sales funnel

Sometimes there are many clicks but almost no sales. In such cases, look for the “bottleneck” — the stage of the funnel where the numbers drop sharply. Perhaps online payments are not working properly, or managers are taking too long to process applications. Fix the problem, and your ROAS will grow.
Sometimes the reason for low return on investment is a poorly designed user journey. One weak link can ruin the entire chain. Imagine: a person saw a post on Instagram, got interested, and went to the website. And then the problems began. They had to search for the “Buy” button, were asked to provide a bunch of unnecessary information during checkout, and finally, a captcha popped up. You would agree that you wouldn’t stay on such a website either.
So go through the entire buyer journey yourself. Click on your own ad, go to the website, and place a test order. Note every moment where even the slightest inconvenience arises. The purchasing process should be intuitive—the fewer steps and questions, the better.