
A study of hidden cannibalization in Google Ads on raw e-commerce account data: 16 months of history, 2.24 million search term rows, four reviewed hypotheses.
Why did I take on this research? I see how Google Ads’ AI approach is changing. Back when Smart Shopping was still running, Performance Max was very raw — in 2024, you could easily test different audiences in signals with the same products in PMax, and campaigns actually moved in different directions. The algorithm primarily focused on audience — and it worked.
Since 2025, I’ve seen the approach start to change. By the end of 2025, the PMax algorithm works completely differently. Audience signals carry less and less weight; the algorithm increasingly looks at signals from the entire account and independently decides where traffic goes. The old approach of “let’s launch two PMax campaigns with different audience signals to capture different audiences” stopped working — yet some advertisers keep testing audiences as if it’s still 2024.
And when clients come to me for an audit — the typical mistake I see: the same product is in two PMax campaigns. The approach survived from the time when it made sense. Now — it doesn’t. But convincing an advertiser with abstract arguments is difficult. So this research is about the numbers, the raw data from one account, showing why such a structure is harmful now.
In an account I recently took on for audit, I noticed a familiar pattern: the same product identifier showed up in two different PMax campaigns simultaneously. Next to the native ID SKU_25570 in the report stood df_SKU_25570 — the same product, but with a modified ID due to feed duplication in Merchant Center. Two Performance Max campaigns saw the same SKU, both were running ads on it.
This pattern is common in e-commerce accounts. Account managers deliberately create a “feed duplicate” with the df_ prefix precisely to bypass the technical limitation of “one SKU = one campaign” and launch a second PMax on the same product. In the industry, there are three typical justifications for doing this:
- Audience segmentation — supposedly, two campaigns “catch” different customer segments: one catches those looking for cheaper options, the other catches higher-paying customers.
- Risk hedging — if the algorithm in one campaign “breaks” or loses its learning, the second one will serve as a backup.
- Hidden A/B test — comparing different tROAS, different audience signals, different asset sets on the same products.
Each of these justifications sounds rational. But they are based on assumptions about how the Performance Max algorithm actually behaves when it encounters two campaigns from the same account competing for one SKU. I wanted to verify this on raw data.
The research question was simple: do two PMax campaigns on the same product cannibalize each other at auction? If so — how exactly and how much does it cost? If not — maybe this pattern is actually useful for business?
Spoiler: the answer turned out to be more complex than any of the three scenarios I expected.
Data and Methodology
The study was conducted on an e-commerce account in the home goods category. Data period — 16 months: December 30, 2024 → April 20, 2026. I won’t be managing this account publicly, so instead of real campaign names, I use neutral designations: PMax A — old campaign, ran the entire period; PMax B — new campaign, started mid-period.
Data
The export from Google Ads was done in five separate exports due to Google Ads’ row limit. Merged and cleaned:
- Shopping product report — 1.65 million rows. Segmentation: campaign × week × product ID. 22 PMax campaigns, of which three were used for analysis. ~30,000 unique SKUs.
- Search terms report — 2.24 million rows. Same period and same three campaigns. 245,000 unique search terms.
- Campaign change history — 986 records of tROAS, budget, and status changes over 16 months. Critically important for controlling confounders.
I cleaned the numbers from European locale (decimal commas, spaces in numbers, quotes), normalized item_id (stripped the df_ prefix from feed duplicates), filtered only those SKUs belonging to the analyzed domain (89.8% of all rows — the rest were discarded as products from other sites in the account).
Methodological Pitfalls I Addressed
This is my fourth study of the PMax algorithm on raw data. In the previous three, I fell into four pitfalls that ruined the initial conclusions. Here, I addressed them consciously even before starting the analysis:
Pitfall 1 — item_id format
Product IDs in two feeds can have different prefixes. In my case, 4,642 out of 9,631 SKUs had the df_ prefix (feed duplicate). Without normalization, shared SKU matching would give 12% instead of the real 50%. Verification: for all 2,375 SKUs that had both versions, the Merchant Center ID in df_X and X matches. That means df_X and X are the same product from the same MC, just with a modified ID.
Pitfall 2 — selection bias
If you group SKUs by their activity after a starting event — Google itself selects top SKUs for the second campaign, and the “campaign effect” turns out to be selection bias. I fix SKU groups by pre-period activity (before the second campaign launch), then look at how each group behaves after.
Pitfall 3 — confounders from change history
A confounder is a factor that changes in parallel with what we are studying, and because of this, it can create the illusion of a cause-and-effect relationship. A simple example: if I want to measure the effect of launching a second PMax on CPC, and precisely in that same week I raised tROAS in the first campaign — the CPC jump could be attributed to either of these two changes. That’s a confounder.
Any change in tROAS, budget, or product filter during the analysis period creates a confounder. I extracted the full change history for all three campaigns. The result showed 89 critical changes (tROAS, budget, status) over 17 months in one pair. In a window of ±6 weeks around the starting event — 40 changes. This is not a “clean natural experiment,” and this must be honestly acknowledged.
Pitfall 4 — product life cycle
In a previous study, the top 50 SKUs turned out to be a specific genre trend that was naturally cooling down. The “PMax dip” looked like an algorithmic effect, but it was a demand cycle. Before drawing conclusions, I looked at the top 20 shared SKUs by conversions — they are an evergreen wall decor catalog with constant demand, not seasonal items.
Study Design
I focused on two campaign pairs with the highest spend on shared SKUs:
- Pair A (longitudinal): PMax A (old, running >12 months) and PMax B (new, started mid-period). 21 weeks of shared history. Reference event = week of PMax B launch. Allows comparing “before” and “after” the appearance of the second campaign.
- Pair B (cross-sectional): PMax A and another old campaign that ran the entire period. 68 weeks of shared history. No reference event here — I compare shared vs solo SKUs within the period. Serves as a validation of Pair A’s conclusions on independent data.
A third candidate for longitudinal comparison turned out to be unsuitable — the campaign operated on a different ID format (without the characteristic domain suffix), so SKUs didn’t match ours. Discarded.
One of the key methodological choices — I compare only the same units. Not “shared SKU vs solo SKU” (these are different product groups with different characteristics), but “the same SKU in two campaigns in the same week.” This addresses a third important layer of selection bias.
Insight 1: Two PMax campaigns bid against each other on the same queries
The first thing I wanted to find out — do the campaigns even catch the same search queries? Maybe Google internally splits them across different auctions (one on category queries, the other on brand queries, for example)? If so — there’s no cannibalization by definition.
I calculated the overlap of search terms between PMax A and PMax B in the post-period — after the second campaign launched. Result:
- Unique search terms in PMax A: 88,027;
- Unique search terms in PMax B: 35,496;
- Overlap: 31,552 — that’s 88.9% of the smaller campaign.
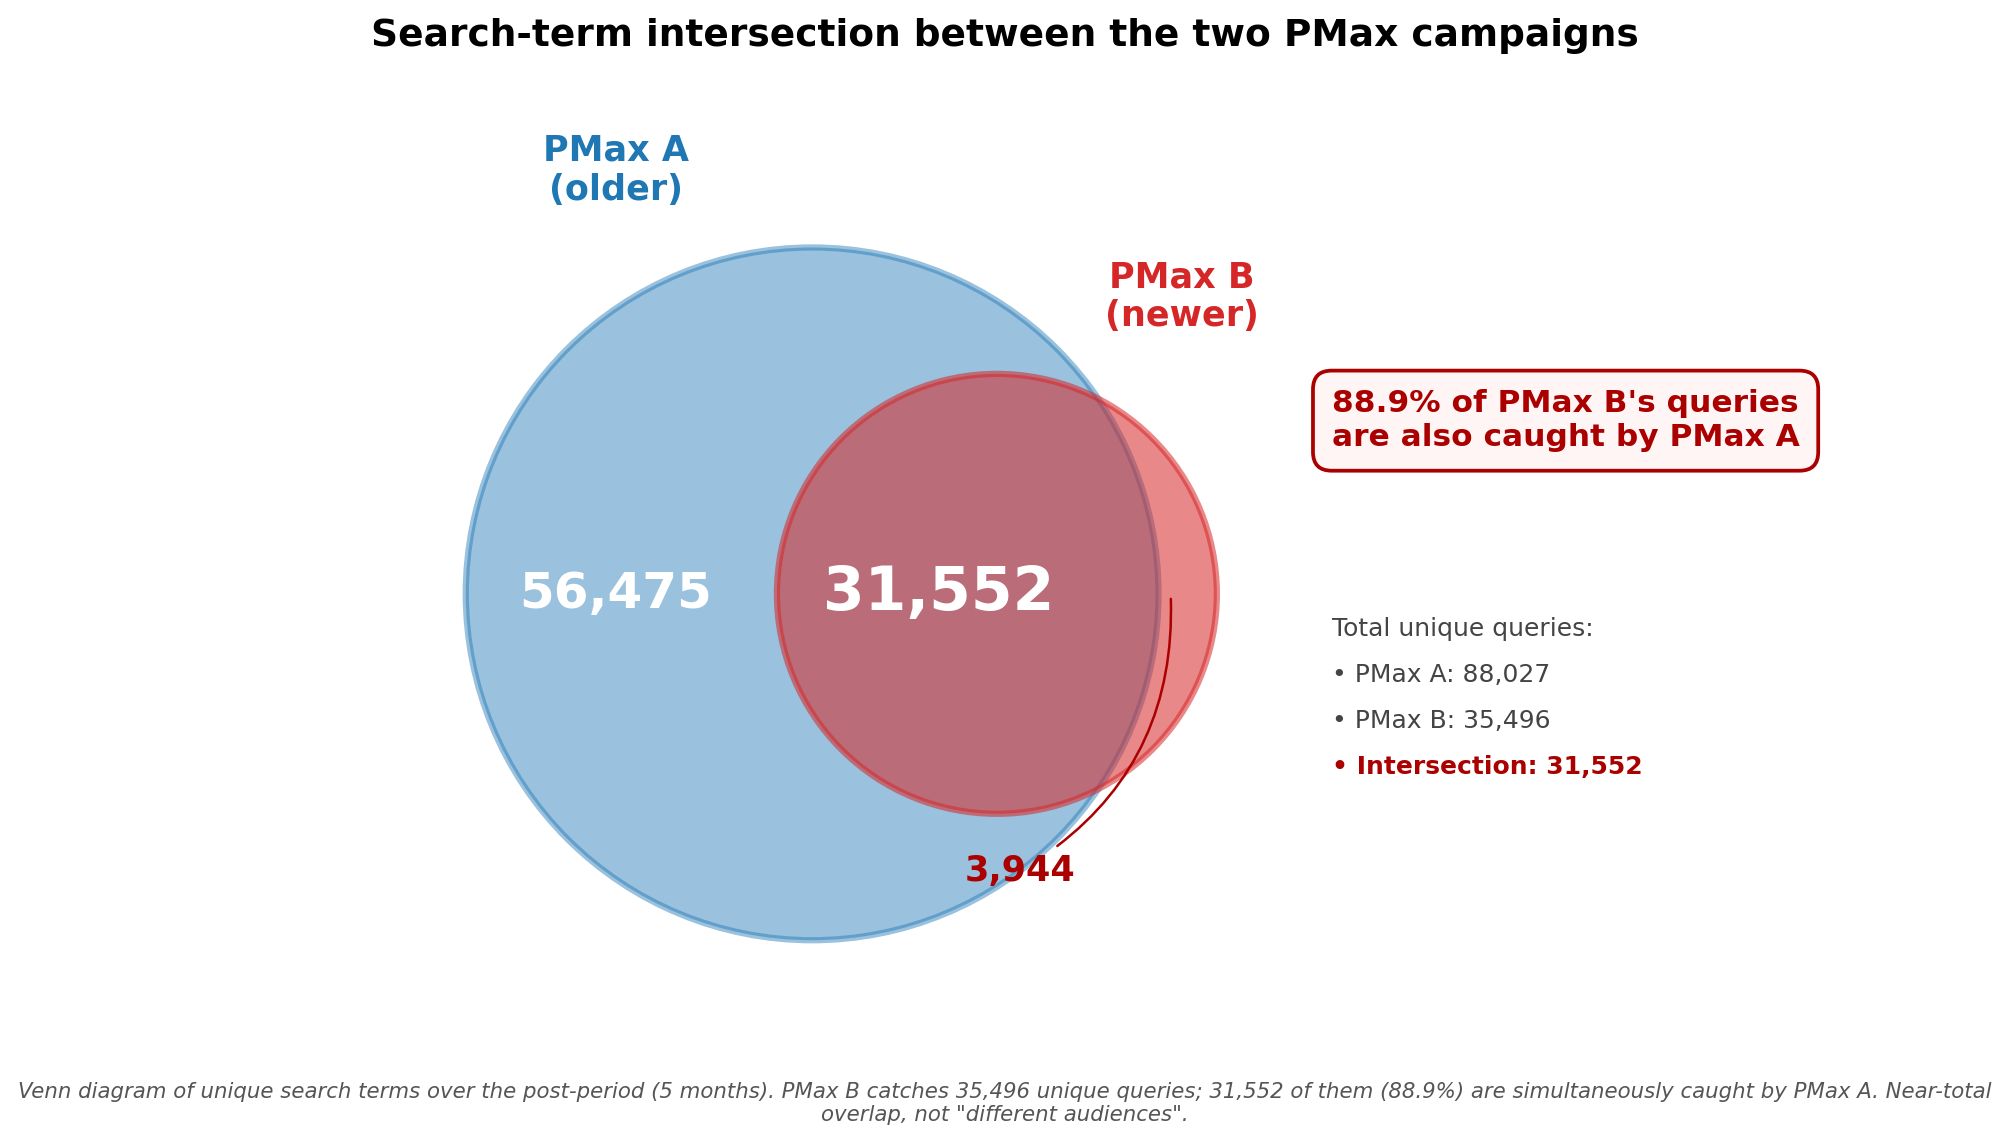
Chart 1. Venn diagram of search query overlap. Almost all queries caught by PMax B are simultaneously caught by PMax A.
88.9% of queries caught by PMax B are simultaneously caught by PMax A. This isn’t “different audiences” — it’s nearly complete overlap. The hypothesis that Google splits campaigns at the query level is rejected.
Next — the main test. On queries where both campaigns received a click in the same week, I compared CPC. If the Performance Max algorithm effectively splits campaigns at the auction level — CPC in both campaigns should be roughly equal. If they compete with each other — the weaker campaign’s bid will be higher.
What does CPC on overlapping queries show?
4,386 “query × week” pairs where both campaigns received a click. Weighted CPC (weighted by clicks):
- PMax A: 1.73 PLN;
- PMax B: 3.01 PLN;
- Difference: PMax B is 74% more expensive.
In 58% of observations, PMax B is more expensive than PMax A for the same click. The distribution is uneven — in the tail (P90), PMax B pays 3.6 times more; at P95 — 6 times more. This isn’t “noise.” This is a clear pattern of bid escalation: when two bidders from the same account enter the same auction, the bid goes up.
Even more interesting — how this pattern depends on query volume. I split overlapping queries into 5 segments by the number of clicks PMax B received:
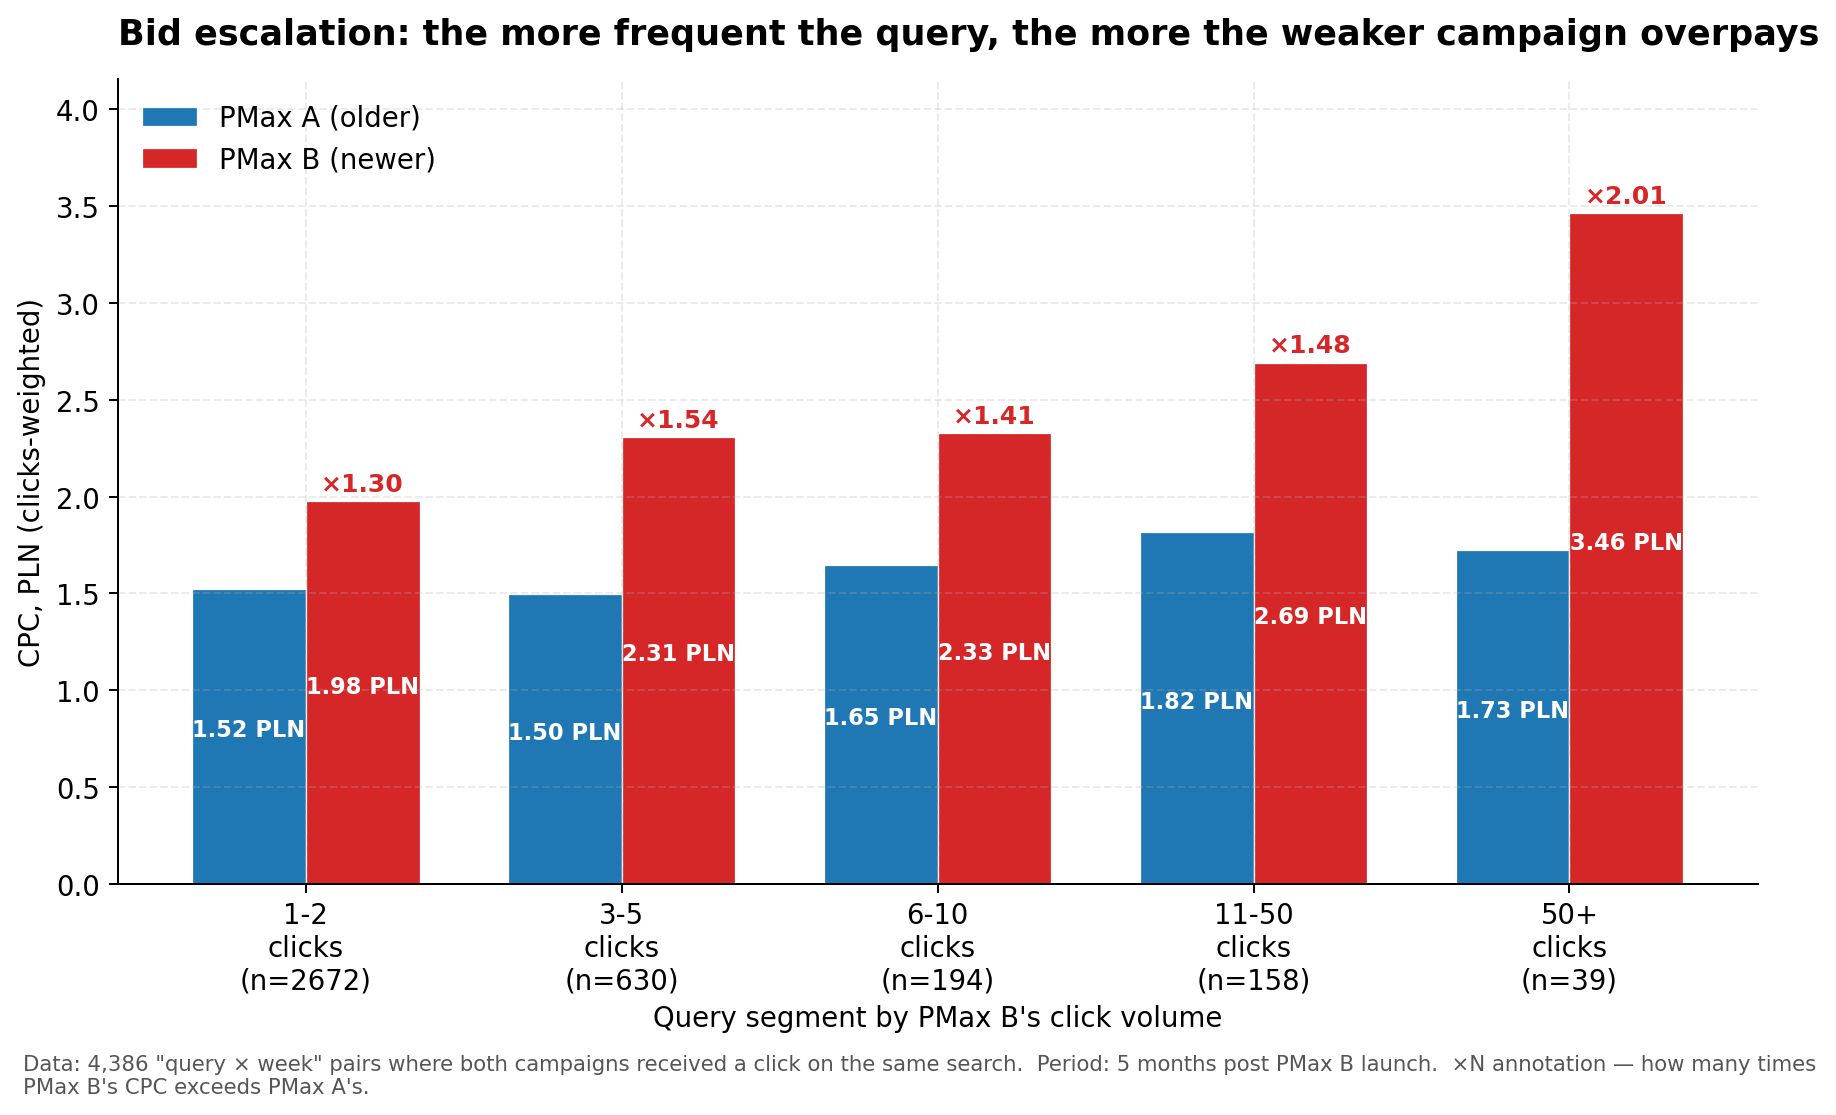
Chart 2. Bid escalation by query volume. On rare queries (1-2 clicks), PMax B pays +30%; on top queries (50+) — 2x more expensive.
The more intense the auction, the higher the tax for dual participation. On rare queries (1-2 clicks per week), PMax B overpays moderately — +30%. On medium ones — +40-55%. On top queries with high traffic (50+ clicks per query per week), PMax B already pays 2x more than PMax A.
What I mean by “tax for dual participation.” When two campaigns from the same account are in one Google auction, the algorithm must choose between them — and does so by raising the bid. As a result, both campaigns pay more than a single participant would have paid. This premium is the tax: money the account gives to Google solely because it has two campaigns on the same product in the system instead of one.
This is classic auction economics: when one party in an auction has an aggressive bid, the other is forced to raise theirs to avoid disappearing from impressions. Under normal conditions, this is a pricing mechanism between independent advertisers. Here, it’s a pricing mechanism between two campaigns of the same company, which have no reason to compete with each other — except that they exist in parallel.
Conclusion 1: the more frequent the search query, the stronger the cannibalization. On top queries, the weaker campaign’s CPC reaches 2x. This isn’t “Google splitting campaigns across different queries” — this is Google sending both into the same auction and collecting a higher bid.
Why does this align with what practitioners see?
From my practice: the typical behavior of PMax — if a strong product is running in two PMax campaigns in an account, one of them is always more expensive. I see this constantly. Bid escalation is a phenomenon that PPC practitioners have been seeing in their own accounts for years. It’s just now been measured.
The second important detail — PMax does not isolate campaigns at the search term level. Google’s documentation states outright: the algorithm considers signals from the entire account when deciding which query to assign to which entity. That means two PMax campaigns are not “two funnels” with their own query funnels, but two strands of the same matrix. And in the places where these strands intersect — the algorithm raises the bid to the level that both are willing to pay.
Insight 2: The myth of audience segmentation
The most common justification for having two PMax campaigns is “one catches cheaper customers, the other catches more expensive ones — audiences are divided.” This sounds convincing: if PMax B catches customers with a higher average order value, then even the CPC overpayment is justified — the value is greater.
In my first iterations of analysis, I was close to confirming this thesis. In PMax B on overlapping queries, AOV (average order value per conversion) turned out to be 1,150 PLN vs 707 PLN in PMax A. Almost 1.6 times higher. I even thought for a moment that I had found a positive effect of duplication — “PMax B catches more expensive customers.”
But I went deeper and found a nuance. The overall average AOV hid the distribution by query volume. If calculated separately by segment — the picture might be completely different.
I split overlapping queries by volume bucket and looked at AOV in each:
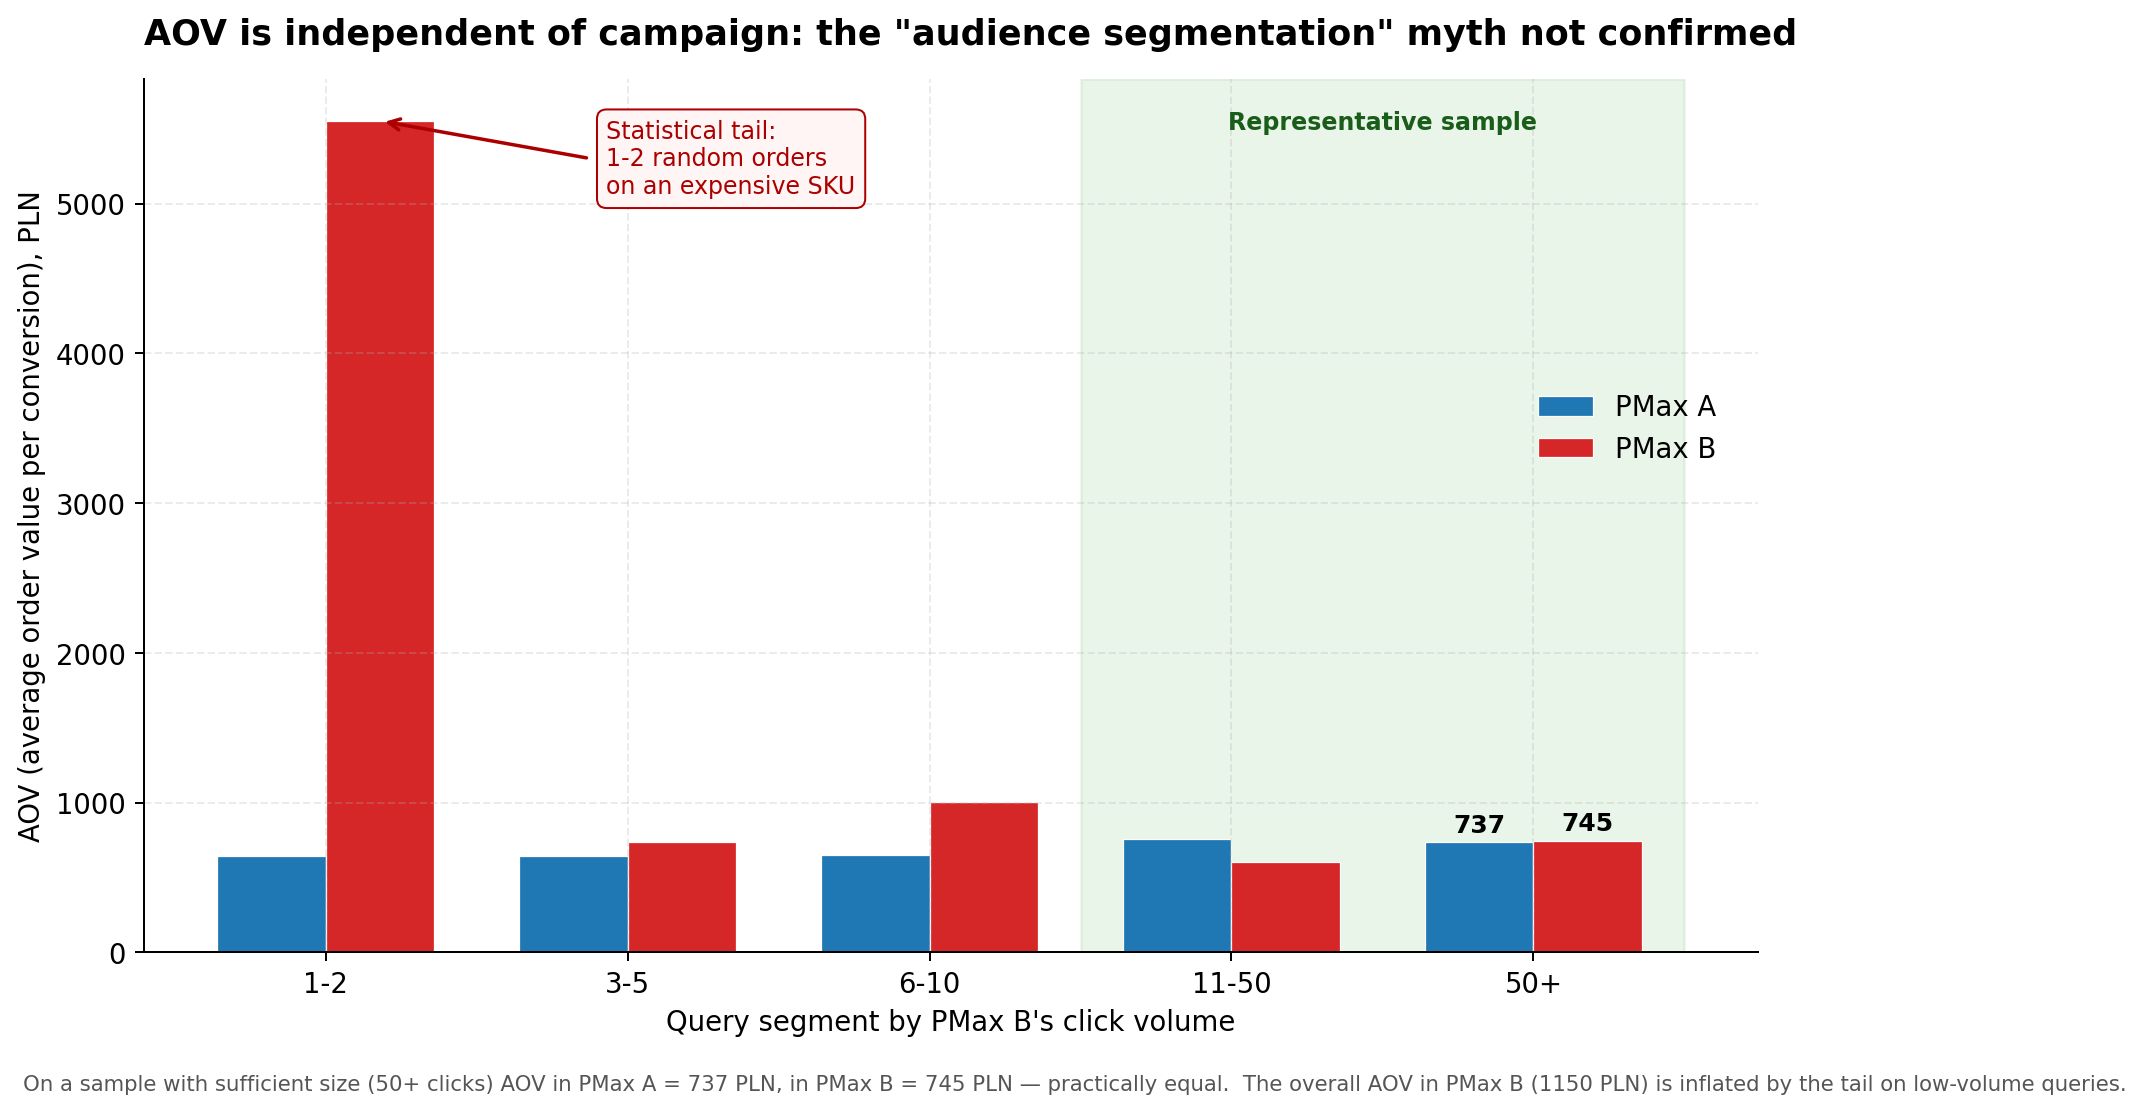
Chart 3. AOV by query segment. On a representative sample (50+ clicks), AOV in both campaigns is nearly equal.
The picture completely changed. In the bucket with sufficient sample size (50+ clicks — the most representative segment), AOV in PMax A = 737 PLN, in PMax B = 745 PLN. Nearly equal.
The overall average AOV of 1,150 PLN in PMax B turned out to be entirely a result of the tail in the 1-2 click bucket. One or two random transactions on an expensive SKU (average order ~5,500 PLN) inflated the group average. If you discard this tail — there is no real “audience segmentation by order value” between the two PMax campaigns.
Conclusion 2: the myth of “segmentation by expensive and cheap customers” is not confirmed. AOV converges to the niche average regardless of which of the two PMax campaigns caught the customer.
This is a methodologically important point. In statistics, there is a known effect: on a small sample, the average is always unstable. One large order of 5,000 PLN turns a group of 10 clicks into a “high AOV segment.” If a manager looks at the aggregated number for PMax B — they’ll see an imaginary advantage. If they look at the distribution by segments — they’ll see it’s an artifact.
This is the fundamental problem of how PPC professionals often evaluate campaigns: “average AOV in campaign X.” When a campaign has an uneven volume distribution across queries (and in PMax this is almost always the case — 80/20), the campaign average is not representative. It’s precisely weighted by the tail.
What does this mean for the “different audiences” theory?
If AOV is the same, two logical conclusions follow:
- Performance Max does not “segment” customers by purchasing power. The algorithm, within the same search query (“category query”), directs traffic to different campaigns, but not by “customer type” — rather by other signals (audience signals in the campaign, creatives in asset groups, landing page). The actual audience pool that each campaign sees is the same.
- This means there is no real “product logic” of segmentation in two PMax campaigns — only an artificial one, through feed duplication. As a result, two campaigns compete for the same pool of customers with the same average order values — just with different asset sets.
This is the point where the theory of “useful duplication” falls apart. If AOV is the same, then all that’s happening is bid escalation from Conclusion 1, which doesn’t bring additional value — only increases account costs.
Insight 3: Real CPA per customer is inflated by 21%
Here I made the most serious methodological error in the first iterations, and here’s how I had to fix it.
Initially, I calculated CPA separately in each campaign on overlapping queries:
- CPA in PMax A on overlap: 340 PLN;
- CPA in PMax B on overlap: 334 PLN.
“Almost identical.” I concluded that the two campaigns are economically neutral — the CPC overpayment in PMax B (+74%) is compensated by a higher CR (2x), and ultimately the customer acquisition cost is the same. Duplication seemed cost-free.
But looking at CPA this way — as a simple metric of an individual campaign — is incorrect for our case. I was looking at CPA as if the customer clicked once and immediately bought. But in reality, in this account, the attribution path is 3.5 interactions / 2.6 days to purchase. That means, on average, 3.5 clicks per conversion. And when an account has two PMax campaigns on the same search queries, these 3.5 clicks are spread across the two campaigns. Here, you need to calculate not the CPA of an individual campaign, but the CPA per customer in total.
Imagine a real customer path: they see an ad for a “category query + specifier” and click (PMax A). A day later, they search again for “category query + room type” and click (PMax B). Another day later, they search for the brand and click again (PMax A). Then they purchase. Who “brought” this conversion? In data-driven attribution — both. Each campaign records part of the conversion. In reports: PMax A paid 5 PLN for that conversion, PMax B paid 6 PLN, each showing an adequate CPA.
But the real cost of the conversion = 11 PLN. That’s the sum of what two campaigns paid to acquire one customer. And this number is not visible anywhere in the Google Ads report.
How I calculated the real CPA
On overlapping queries over 5 months post-period:
Metric | Value |
Total spend (PMax A + PMax B) | 116,233 PLN |
Total conversions (both campaigns) | 494 |
Real CPA per customer | 235 PLN |
Total value (both campaigns) | 427,514 PLN |
Total ROAS | 3.68 |
Real CPA = 235 PLN. Not 340 or 334 as seen in the reports. 235.
Now the counterfactual comparison. What would have happened if only PMax A were catching these queries? Conversions would still have happened — the customer searches for a category query on the same site, with the same product catalog. They would have clicked on PMax A instead of PMax B at one of the path steps and arrived at the same purchase. Costs would have been lower because CPC in PMax A on overlapping queries = 1.73 PLN, whereas in PMax B = 3.01 PLN.
Calculation:
- Total overlap clicks: 51,428;
- CPC in PMax A on overlap: 1.87 PLN;
- Counterfactual cost (all clicks at PMax A CPC): 95,996 PLN;
- Conversions (assuming the same): 494;
- Counterfactual CPA: 194 PLN.
Difference between actual and counterfactual CPA = 41 PLN per conversion. As a percentage — 21% inflation.
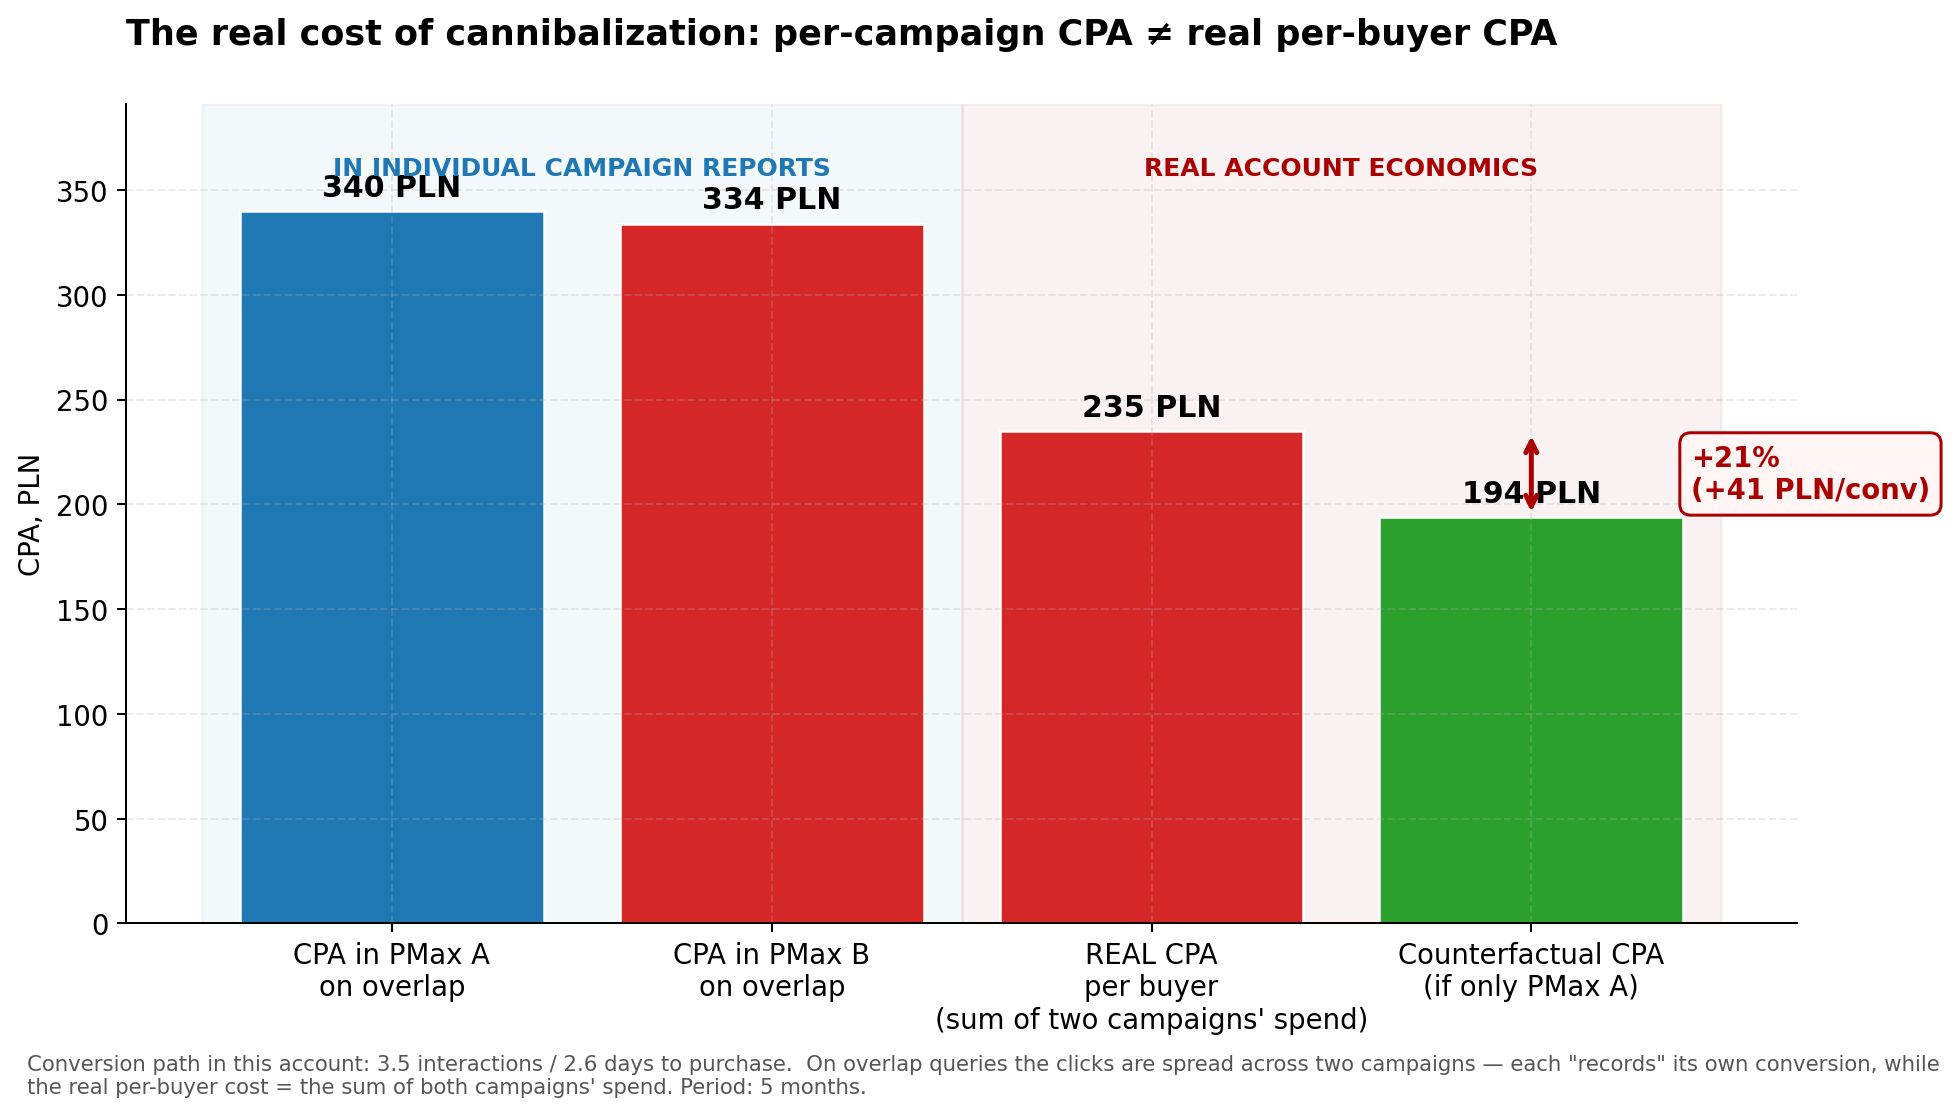
Chart 4. CPA in individual campaigns (340 and 334 PLN) looks the same. Real CPA per customer, accounting for total spend of both campaigns — 235 PLN. Counterfactual without duplication — 194 PLN. Difference +21%.
Conclusion 3: cannibalization inflates the real CPA per customer by 21%. In individual campaign reports, this is not visible — metrics look normal. The inflation is only noticeable when calculating the total account economics by key SKUs.
Why is this mistake so typical?
I’m not alone in making this mistake. It’s the basic way of looking at campaign performance: open a campaign report — see CPA. If CPA is within KPI — the campaign is healthy.
But this only works when campaigns are independent. If they share the same customer base — each shows “its” portion of the same conversions, and the individual CPA looks fair. The total spend per real customer — is invisible.
The shorter the attribution path, the less noticeable the effect. If the account has 1.2 interactions per conversion — the overpayment will be ~5%. If 3.5 — as in our case, 21%. If 5+ — it could be 35%+.
On small budgets and complex conversion paths, the cost increase is even more than 21%. Two PMax campaigns on the same niche embed a hidden premium into the CPA, which the account manager doesn’t see — because in the individual campaign, metrics look normal.
Total overpayment over time
I calculated the weekly overpayment on overlapping queries. Formula: cost_PMax_B − (clicks_PMax_B × CPC_PMax_A on the same query). That is, how much PMax B paid beyond what PMax A would have paid for the same clicks.
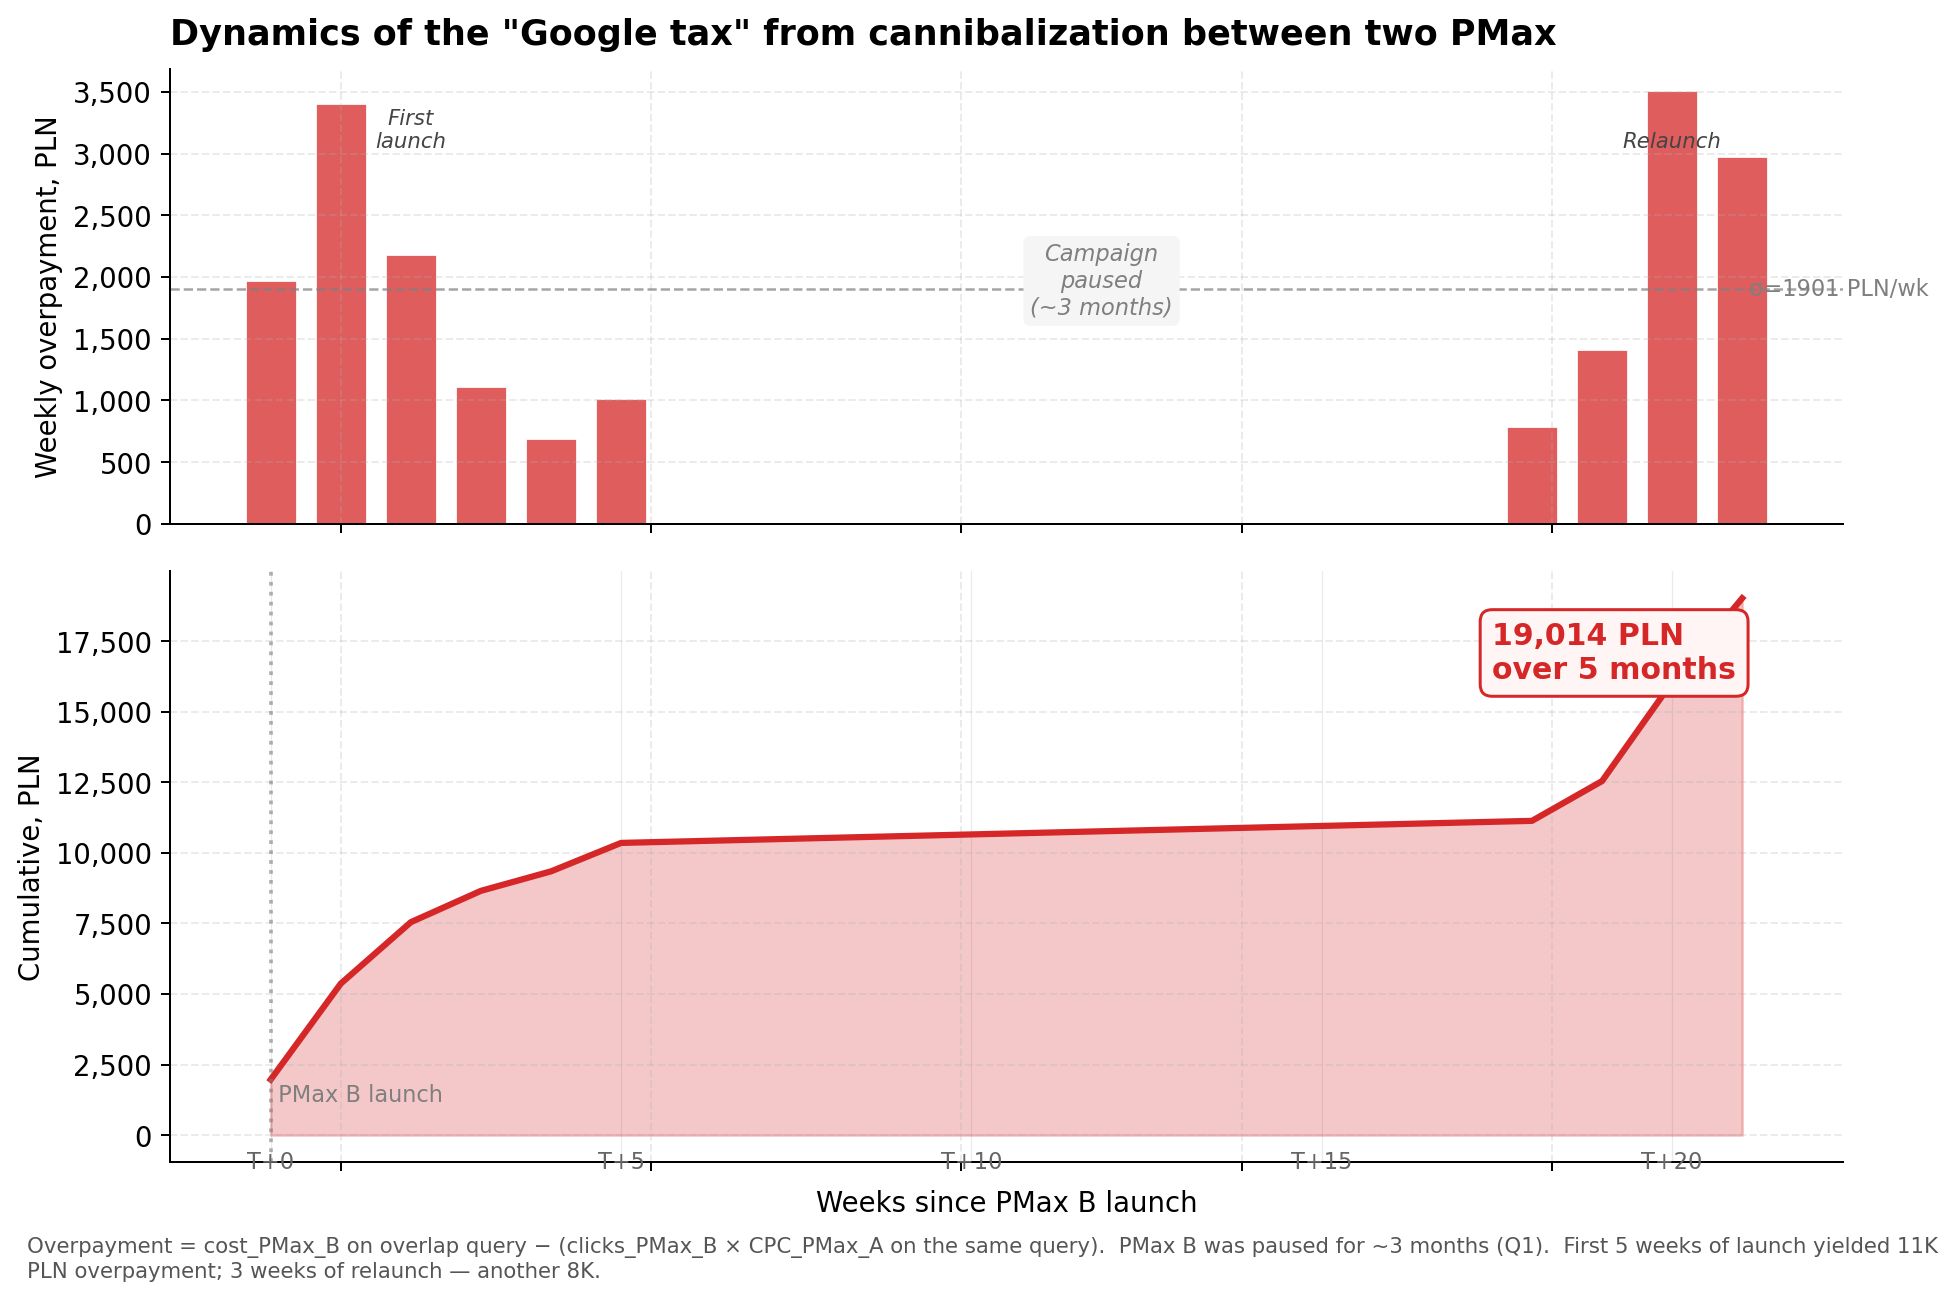
Chart 5. Weekly overpayment (top) and cumulative sum (bottom). PMax B was paused for ~3 months in the middle of the period — so the cumulative curve has a plateau.
Total overpayment over 5 months post-period = 19,014 PLN. This is pure money given to Google because two campaigns from the same account were raising bids against each other.
Interesting pattern on the chart: overpayment occurred only in the first 5 weeks of launch, then subsided, then flared up again after restarting PMax B in April. Between them — 3 months of pause when campaign B was not active. This confirms the effect isn’t a “data artifact” — it directly correlates with when the second campaign is running.
Projection for a year: ~45,000 PLN in excess spend. On one account. On one campaign pair. The same account has other pairs with overlap, which I haven’t deeply analyzed — the real number across the entire account is likely higher.
How does this work technically?
It remains to explain the mechanics. Why would two PMax campaigns from the same account compete with each other at auction? Shouldn’t Google “split” them?
The answer — yes and no. Google splits impressions, but not CPC. The selectivity is visible in the numbers themselves: on overlapping queries, PMax A takes 95% of impressions and conversions, PMax B — 5%. That means the system does not let both campaigns into the same impression in parallel — only one appears on a specific impression.
But CPC is not compensated by this distribution. The Google auction works so that a campaign’s bid depends on competition and its tROAS. When PMax B enters a high-volume query with an aggressive bid (Google aims to spend its budget on the best positions), it forces PMax A to also raise its bid — otherwise PMax A will stop appearing. As a result, both pay more than they would have if they weren’t competing.
It’s interesting to look at the top 15 queries that bring the largest absolute overpayment:
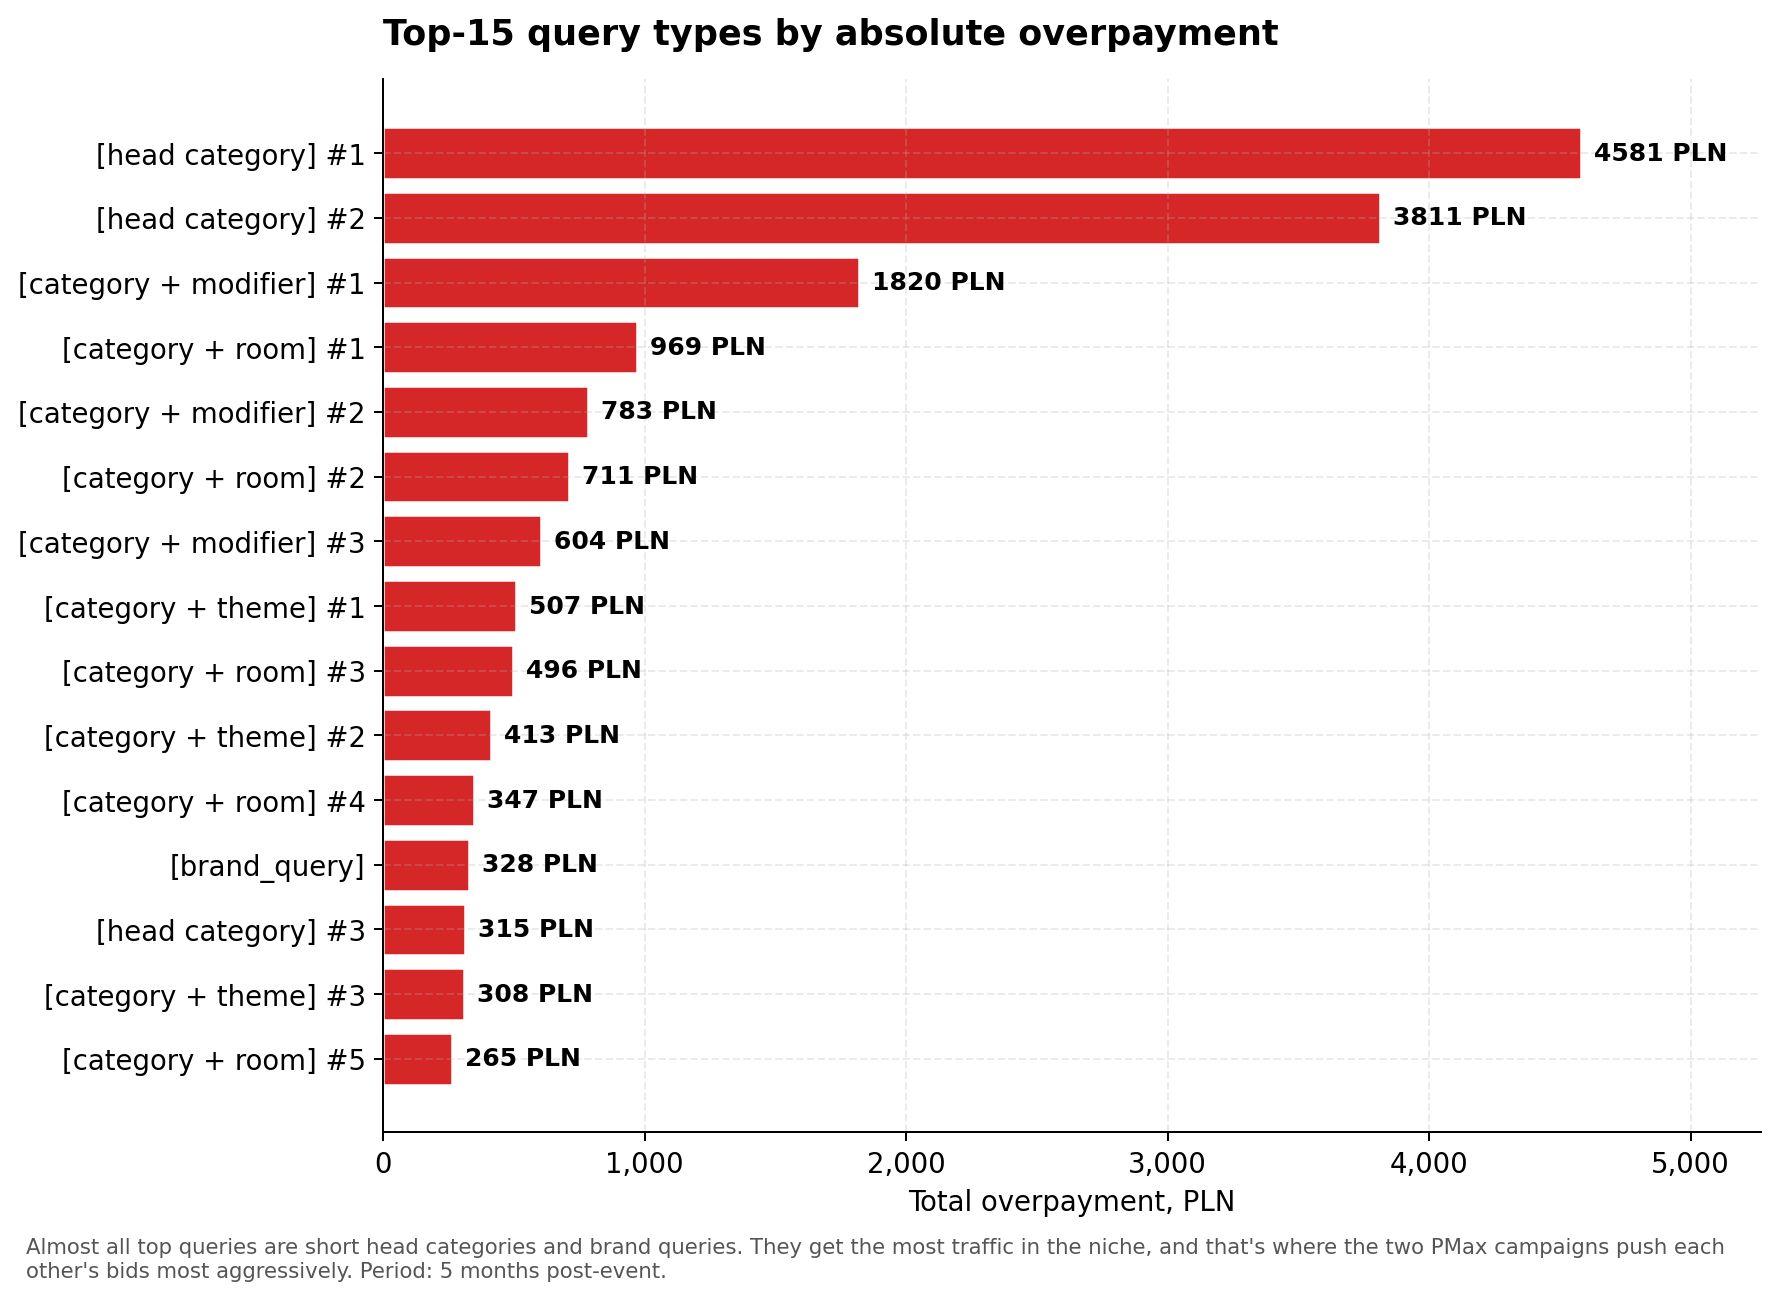
Chart 6. Top 15 search query types by overpayment. Almost all are short head categories and branded queries.
Almost all top queries are short generalized head categories and brand terms. These bring the most traffic in the niche, and it’s on these that the algorithm raises the bid the most. On long-tail queries, the effect is weaker — auction density is lower there, and interference is less noticeable.
This aligns with the logic of Conclusion 1 — bid escalation grows with query volume. On rare long-tail queries, PMax B overpays moderately (+30%). On expensive head queries — 2x. Ultimately, the bulk of the overpayment is concentrated on the 10-15 queries that bring the highest traffic volume.
What does Google’s documentation say?
In the official Google help documentation, it’s directly stated that PMax considers signals from the entire account. In the official Performance Max announcement from 2021: “Performance Max uses your campaign goals, audience signals, and assets across the account to find new conversion opportunities.” That is, the algorithm deliberately looks at the broad account picture, not isolating each campaign into its own funnel.
In practice, this means: two PMax campaigns from the same account, even with different feeds, even with different audience signals — are not “two independent systems.” They are two branches of the same matrix that internally competes for budget, conversions, and impressions. Duplicating item_id through the df_ prefix does not bypass this architecture — it only makes the interference more noticeable.
Conclusions
The study produced three main conclusions and one generalization:
Auction cannibalization exists and is measurable
On search queries where both PMax campaigns are active, the weaker campaign pays 30-100% more per click, depending on auction intensity. On top queries — 2x more. 88.9% of queries caught by the second campaign are simultaneously caught by the first.
“Audience segmentation” is a myth
AOV is the same in both campaigns when calculated on a representative sample. The overall average may appear different only due to tail unevenness in distribution — a small-numbers artifact, not real segmentation. The justification that “one catches cheap customers, the other catches expensive ones” is not supported.
Real CPA is inflated by 21%
Due to an attribution path of 3.5 interactions per conversion, two campaigns split the clicks of the same customer among themselves. In individual campaign reports, CPA looks normal (340 and 334 PLN). Real CPA per customer = 235 PLN. Counterfactual without duplication = 194 PLN. Inflation of 21% (+41 PLN per conversion).
Two PMax campaigns on the same product feed — this is not “hedging” and not an “A/B test.” It’s a structural Google tax. On a search query where both are active, the weaker campaign’s CPC rises by 30-100%. There is no real audience segmentation between campaigns. The total account CPA is inflated by 20%+. This is invisible in individual campaign reports. Only the total account economics by key SKUs reveals the pattern.
Study Limitations
Honest about the weaknesses:
- One campaign pair, one niche. Conclusions may differ for other niches or other account structures. Replication on 5-10 accounts from different niches would provide a more robust picture.
- Counterfactual — an assumption. I assume that without PMax B, all conversions would still have come through PMax A. This is plausible but not proven. A clean test would be an A/B test turning off PMax B for 4 weeks.
- Confounders in change history. 89 critical tROAS and budget changes over the period violate the “all else equal” condition. The longitudinal conclusion from Pair A on this account is partially compromised. The cross-sectional from Pair B remains valid.
- I do not analyze secondary pairs. The top 3 pairs by overlap are concentrated around one large campaign (PMax A). Possibly, in pairs without its involvement, the pattern is different. This is the next step in the research.
Open Questions
The study did not answer:
- Whether cannibalization is equally strong on accounts with shorter attribution paths (1.5-2 interactions per conversion). Hypothesis — weaker, because there are fewer opportunities for repeat clicks.
- Whether cannibalization can be reduced through strict audience signals or negative keywords (although PMax has no direct negative keywords).
- How a second PMax behaves on accounts where the first has a very small budget — whether a reverse effect is possible where the second campaign “pulls” the first along.
- What a similar analysis looks like for Standard Shopping + PMax instead of PMax + PMax.
This is material for future parts of the PMax algorithm research series.
FAQ
-
Not always, but in the vast majority of current cases — yes. The exception is cases where two campaigns genuinely have different economic logic: different countries, different languages, different funnel stages (e.g., one for new customers, the other for remarketing). In such cases, overlap is naturally low, and cannibalization does not occur. In an e-commerce account where both PMax campaigns target the same market niche and the same product feed — overlap will be about 90%, as in this study, and duplication is harmful.
-
The simplest way — open the “Products → Status in each campaign” report in Google Ads UI. If you see the same item_id “eligible in N campaigns: 2, 3, 6” and these are PMax campaigns — you definitely have overlap. A deeper check — export the search terms report for the period when both campaigns are active, and see how many queries are shared. If overlap is >50% of the smaller campaign and it has shown noticeable traffic volume — cannibalization is almost guaranteed.
-
Google’s documentation does not prohibit duplication, but neither does it recommend it. It directly states that PMax considers signals from the entire account — meaning Google knows about the architectural consequences but is not obligated to warn about the economic ones. Which is logical: the overpayment for dual participation is Google’s revenue, not its problem. The algorithm technically does what is asked of it (show on that SKU in two campaigns), just at a higher total price per result.
-
If the goal is to split campaigns into different product groups without overlap, custom_label segmentation is effective. One SKU falls into only one campaign by rule — and cannibalization is absent by definition. If the goal is to duplicate SKUs in two campaigns through the
df_prefix while custom_label is not used for separation — segmentation does not help because it is not active. In the study, I did not analyze an account with custom_label architecture — that’s a separate question for a future article. -
Yes, more strongly. On low-budget accounts, campaigns more often hit their budget limit — and when this happens, auction dynamics become distorted: the algorithm bids more aggressively to spend the budget by the end of the day. Two low-budget PMax campaigns on the same products create stronger bid escalation than two well-budgeted ones. Plus, on small budgets, each additional conversion costs more due to the learning phase effect — which restarts with every relaunch. In this study, I work with a mid-size account, so 21% is more likely the lower bound of the effect, not the upper bound.
-
The best approach — show the client the numbers. This text was written specifically so that a concrete case can be used as an argument. If the client continues to insist, a “soft” solution is to make the campaigns as different as possible across all other parameters: different product groups through listing groups (minimum SKU overlap), different bidding goals (one on ROAS, the other on conversions), different landing pages. This doesn’t fully eliminate cannibalization, but minimizes it. The hard solution — set up an A/B test: turn off one of the campaigns for 2-3 weeks and measure whether the total account CPA worsened. If not — the decision makes itself.