Hello everyone. My name is Yana Lyashenko, and I am a Google logistics specialist. My job is to bring targeted audiences with the right characteristics to your business and help scale online sales through smart strategies and AI tools in Google advertising campaigns.
Today’s material is prepared for those who want to understand the nuances of intelligent bidding strategies within Performance Max — currently Google’s most advanced advertising tool.
This topic didn’t come out of nowhere: questions about it regularly come in from specialists during consultations and from business owners who manage their own advertising, love digging into settings, testing hypotheses, and getting to the bottom of every parameter.
Why do questions arise when switching between “maximize conversions” and “target ROAS”?
This is a question I hear constantly — in various forms. For example: “I switched the campaign from maximize conversions to target ROAS — and sales collapsed. What’s wrong?” Or the opposite situation: ROAS dropped so much that the person goes back to maximize conversions — and the results disappear completely. Sound familiar? I think many have faced this.
Below, we’ll break down the fundamental difference between these strategies and what pitfalls to consider when switching.
But first — an important disclaimer. Everything I’m going to tell you is based on my personal experience and observations of dozens of advertising accounts. Your situation may look different — and that’s normal. If your experience differs, share it in the comments so other readers can see an alternative perspective.
Why can’t my observations 100% match what’s happening “under the hood”? It’s simple: I don’t develop this tool and don’t know in detail what specific algorithms are built into it. Plus, Performance Max runs on AI, and machine learning is unpredictable. The more data the system receives, the more freely it “improvises.” Sometimes so much that the results surprise even the developers who laid the foundational logic.
The difference between “maximize conversions” and “target ROAS”
So, today we’ll figure out: why does maximize conversions usually generate fewer sales, while target ROAS generates more? How do you squeeze more orders out of ROAS without dropping profitability metrics? And in what cases would maximize conversions still be the right fit for you?
All of this — using Performance Max as an example, because this campaign type only offers two bidding strategies. Google simply doesn’t provide other options.
“Maximize conversions”
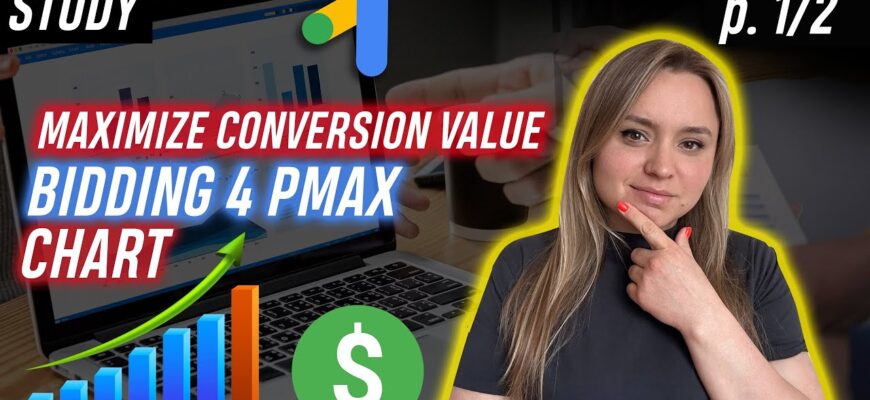
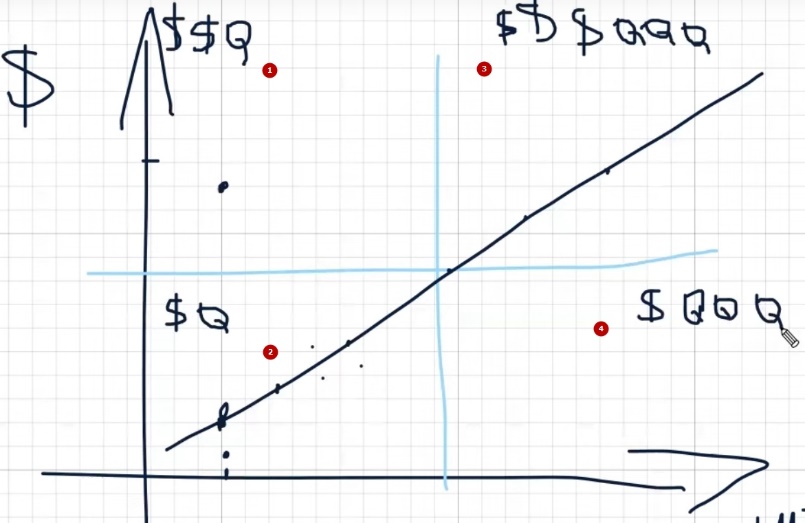
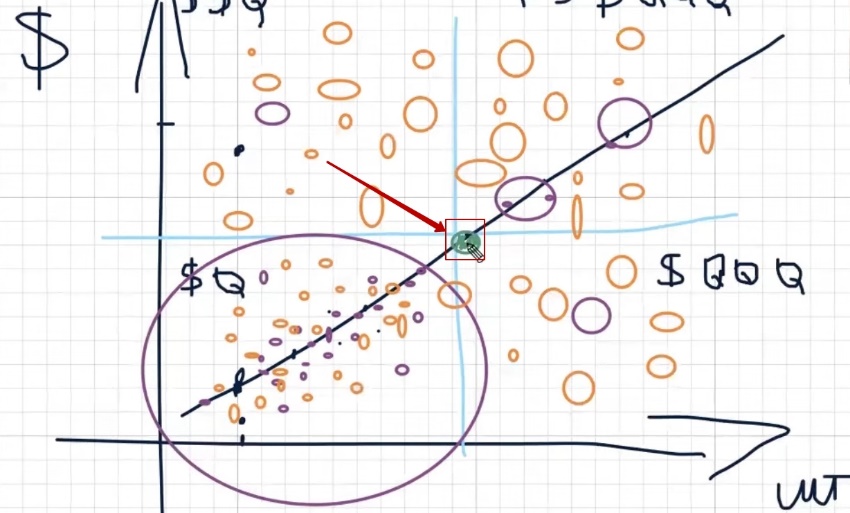
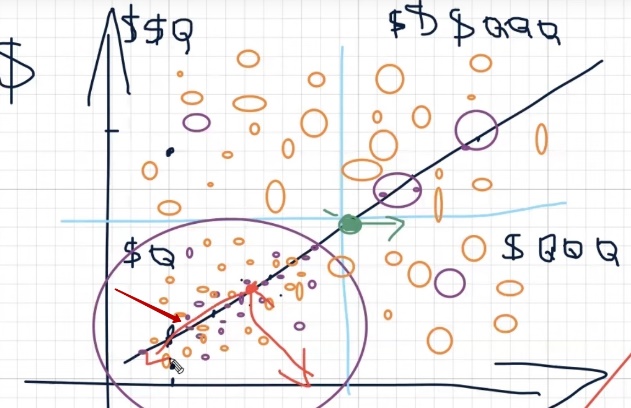
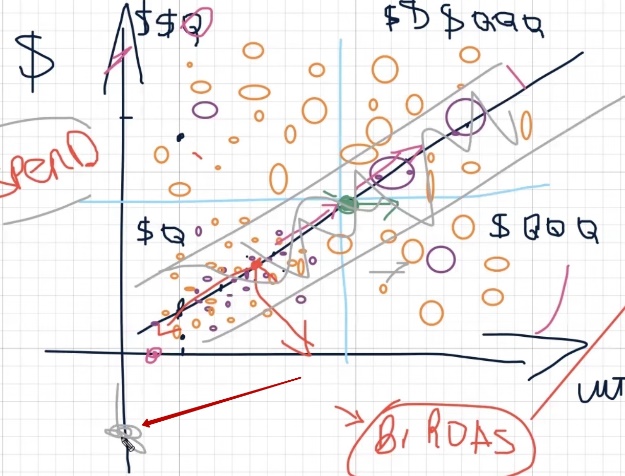
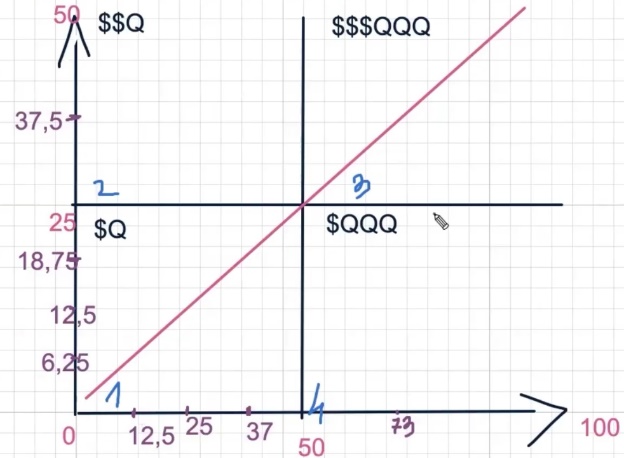
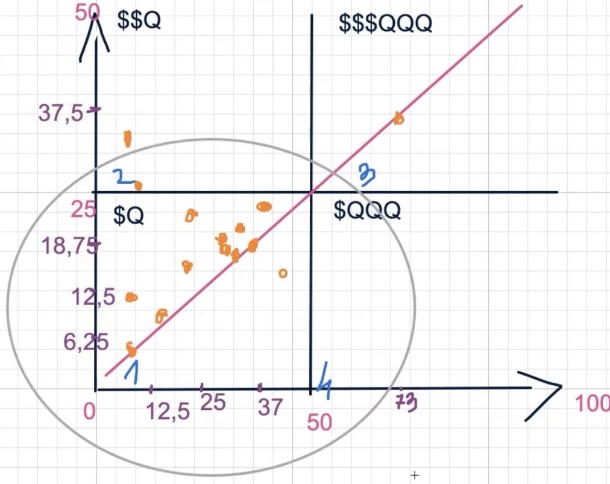
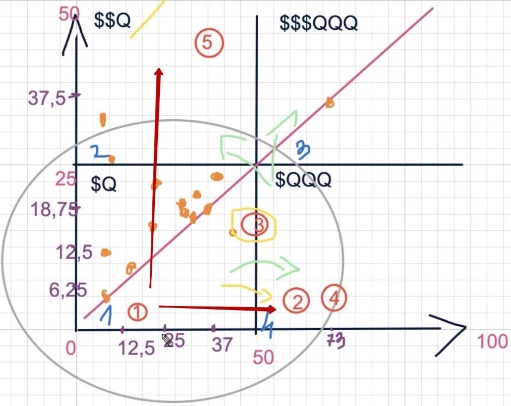
I’ll start with maximize conversions. To make it clearer, imagine a simple graph. On the vertical axis (Y-axis) — revenue in dollars. On the horizontal axis (X-axis) — number of sales in units. A diagonal growth line runs across the entire graph — this is the ideal scenario that any business strives for: steadily increasing both order volume and revenue simultaneously.
Now mentally divide this graph into four quadrants. In the bottom left corner — the zone where there are few sales and low revenue. Place a point anywhere in this quadrant — you’ll see that you haven’t really moved anywhere. Few units, little money. This is roughly how maximize conversions behaves in most cases.
What’s its fundamental difference from ROAS? This bidding strategy moves exclusively along proven routes. And “proven routes” for the algorithm means how previous conversions were achieved. This is why it’s critically important which specific conversions you upload to your advertising account. Whether to add calls or not is a separate topic, but the point is that incorrect conversions can lead the algorithm completely astray.
If we’re talking about online stores and focusing on purchases, the machine learning model here is fairly simple. It relies on three main user actions: viewing a product card, adding to cart, and purchasing. That’s it. No magic. And maximize conversions usually works strictly within this line — not going beyond the behavioral patterns already familiar to the algorithm.
Let me give an example for clarity. Suppose your store sells sneakers, and over the past month, most purchases came through specific Nike model cards. Maximize conversions will show ads for these same cards again and again, because there are already confirmed conversions for them. It won’t take risks and test new audiences or products — for it, those are uncharted territory.
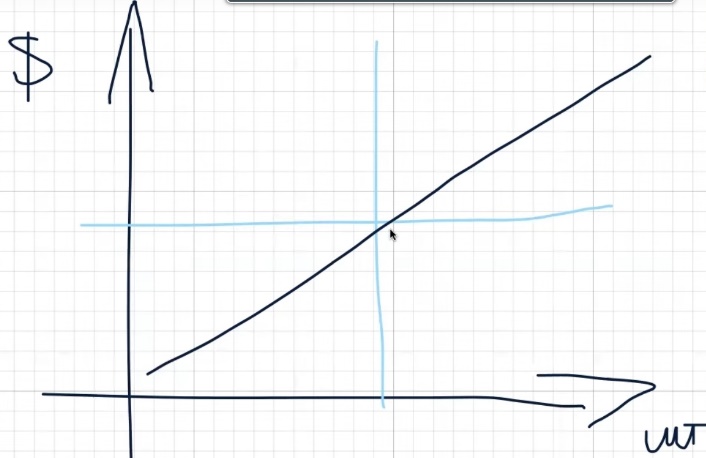
This strategy may occasionally go beyond the usual graph, but not far. Most likely, your point on the graph will end up not even in the moderate growth zone, but somewhere in the bottom quadrant — where there’s little money and few units sold. Yes, a random sale with a high check might land in the upper quadrant, but it won’t change the overall picture.
Let’s break down each quadrant in simple terms. In the upper left — revenue seems decent (conditionally, two dollars per order), but few units sold. In the bottom left — bad on both counts: no money, no volume. In the upper right — the ideal picture: revenue is at the level (let’s designate as three dollars, meaning expensive orders), and the number of sales is pleasing. And in the bottom right — many units, but the average check is rather low.
So, the key difference between maximize conversions and target ROAS is in how each of these strategies moves across the graph. And here, your average check is critically important.
Maximize conversions physically cannot generate a large number of orders above a certain cost threshold. This threshold is unique to each niche. For example, for pool stores — it’s one amount, and quite high. For dishware or kitchen themes, the boundary might be at one and a half to two thousand. And for something simpler — it could be 50 euros. Up to this mark, the strategy works efficiently, but beyond it, it hits a wall.
It’s important to understand: maximize conversions is a strategy extremely sensitive to the ratio of budget and cost per conversion. It works great for launching an advertising campaign when you need to gather initial data and get first orders. But for scaling sales, it often becomes a bottleneck.
Here’s a real example. There’s a case on YouTube for home goods where a store was reaching 200–300 sales per day. They specifically tested both strategies in parallel. On target ROAS, the campaign literally took off — volumes grew quickly and confidently. On maximize conversions, movement was slow, but cost per conversion remained stable. These are two completely different behavioral models.
Now imagine: you launch Performance Max on maximize conversions in your niche — whether it’s auto parts, flowers, coffee, furniture, mopeds, or anything else. Each niche has its own price boundaries and peculiarities. But if we take the average picture — and I regularly see confirmation in my Telegram chat where people share results — a typical message sounds like this: “Launched on maximize conversions, conversions are coming, growing, but the average check is quite low.” For example, up to 500 UAH. And it’s in this range that the strategy feels confident.
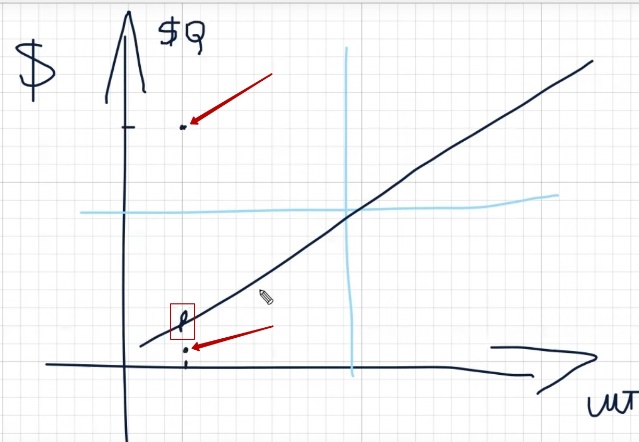
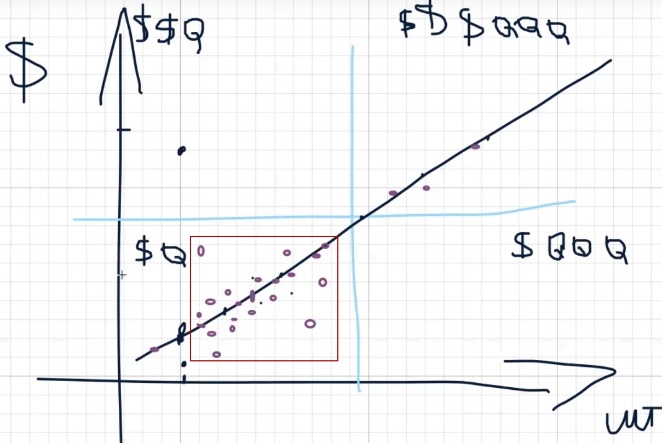
What does this look like on our graph? If you imagine a scatter plot, all your sales on maximize conversions will cluster in the bottom left quadrant — many small points grouped in one zone. Occasionally, individual points will land slightly higher or to the right, depending on pricing and how you manage your campaign budget: whether you increase it in time, how smoothly you scale. Each of these points is a real sale, a real customer found through advertising. But the overall picture remains pinned to the origin — many small orders without a serious upward leap.
Overall, on checks up to 500 UAH (that’s roughly 15–20 dollars or euros, depending on the exchange rate in Ukraine), maximize conversions will spin predominantly in the lower part of our graph. This is where the bulk of sales will concentrate. Yes, individual orders will slip into adjacent zones — slightly higher, slightly to the right. You can’t say that automation and AI work strictly along one line.
For example, in search campaigns or in the Display Network, the algorithm gathers conversions quite precisely along the set route. But in Performance Max, there’s more advanced AI — it can use audience targeting and go beyond familiar frameworks. Nevertheless, sales volumes outside the main zone will be significantly more modest.
Suppose you sell home goods — kitchen accessories, bathroom accessories, tools — and your average check fluctuates around 20–30 dollars. The strategy will predominantly simmer in the bottom quadrant. It will land in other segments, but such sales will be noticeably fewer.
“Target ROAS”
And now for the most interesting part — how is target ROAS different? Here, a whole set of factors comes into play that maximize conversions doesn’t have. This includes the size of your advertising budget, your accumulated analytics, what products were purchased before, and what price each product position has relative to your planned ROAS value (the ROAS you set in the bidding strategy settings).
The essence is that ROAS doesn’t care — did you leave only 500 UAH items in your feed, or did you add positions at 50,000 UAH. It will analyze and model advertising behavior taking into account your entire price range. Every price change, every discount — the system notices instantly. Say, a product cost 30 dollars, but the revenue from it was only 15 — the AI sees this and accounts for it.
This is why it’s not recommended to set a static conversion value for purchases (for example, fixed 300 UAH or 10 dollars). It’s much more effective to use dynamic value so the system understands the real revenue from each order — accounting for discounts, promo codes, and the actual check amount.
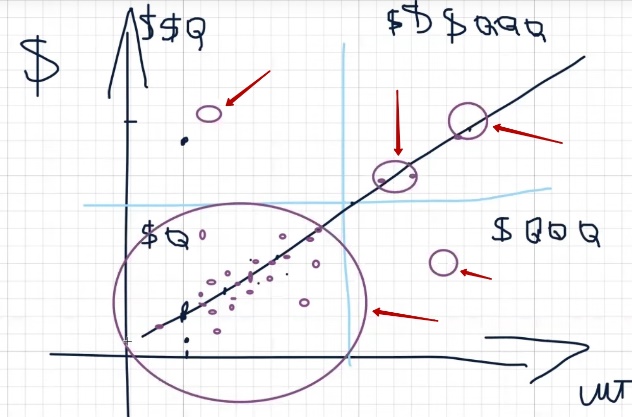
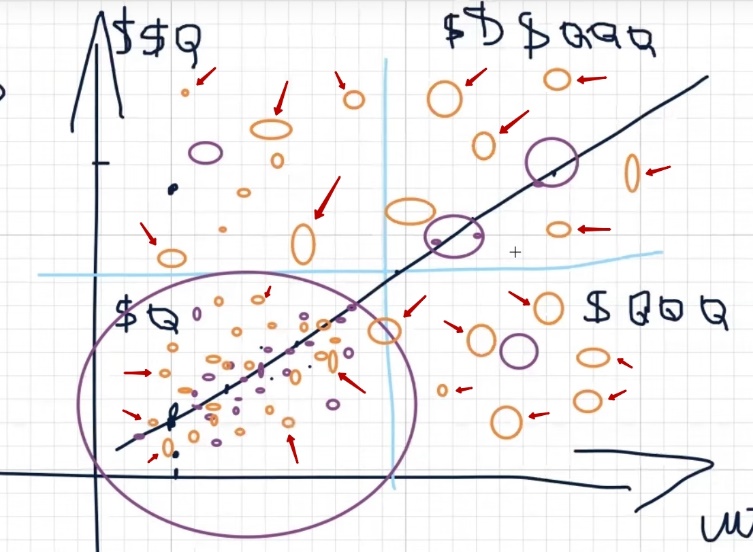
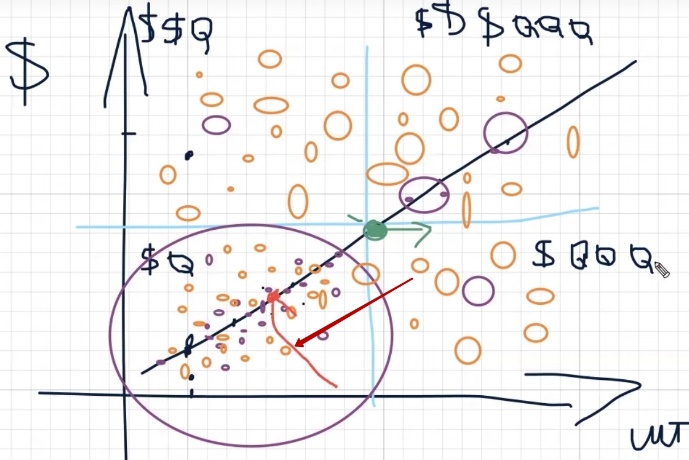
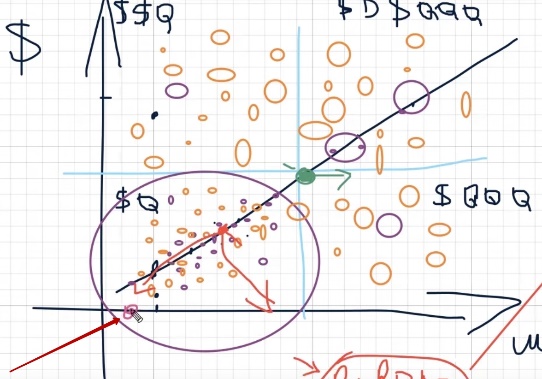
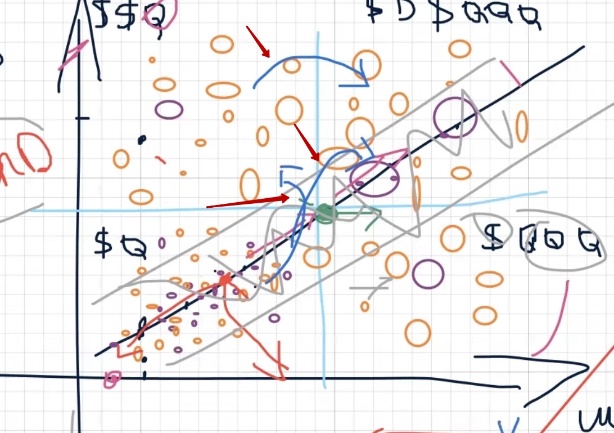
So, back to our graph. If maximize conversions drew us a cluster of points in one quadrant, target ROAS is a completely different story. The number of points on the graph increases many times over. Moreover, they’re scattered across completely different zones — both in the upper quadrants and to the right. The probability of landing where you need to be is significantly higher with this strategy.
What’s the secret? Target ROAS is essentially an upgraded AI that knows how to enter different audience segments and work with different price ranges. But on one condition: the system must have a training base. If the AI understands what’s happening with your products, sees purchase history and price dynamics — it’s capable of finding buyers in those zones of the graph that maximize conversions simply can’t reach.
By the way, this explains why attempts to “hack the system” through additional feeds or other workarounds often don’t work. Somewhere such tricks work poorly, somewhere they give no results at all. But in Performance Max with properly configured ROAS, everything looks much better — the strategy covers different quadrants of the graph while still squeezing out your set return on ad spend for you. It turns out to be a kind of golden mean between sales volume and return on investment.
The “golden mean” of profitability and sales
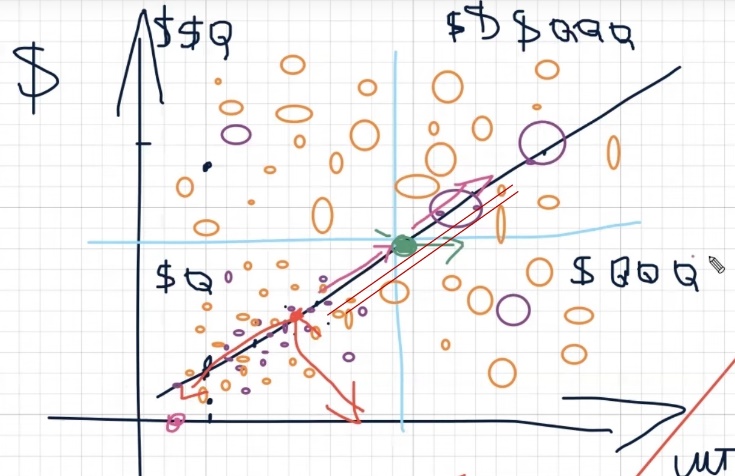
Let’s imagine that somewhere in the middle of our graph is that very balance point — the golden mean. This is the state when you get good returns and at the same time see sufficient sales volume. You’re satisfied with the advertising results, feel confident. Of course, you’d want more — more margin-rich items in orders or simply more units. But overall, everything works and brings results.
What happens when you try to shift this balance? You try to increase the number of orders — and immediately notice how profitability drops. You try to pull returns higher — you lose in volume. A seesaw familiar to anyone who’s worked with Performance Max.
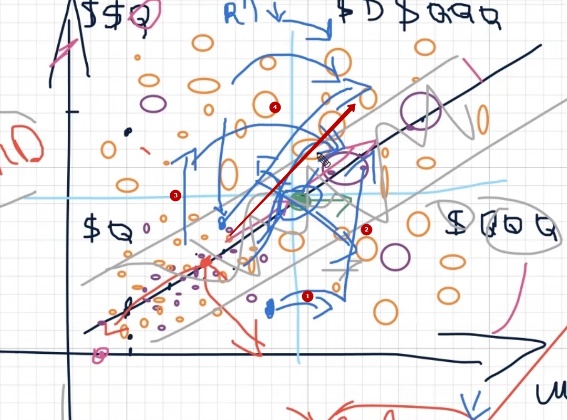
But this is the strength of target ROAS: if you found your golden mean and let the system train on it, the AI can move in any direction you need on the graph. Want more units — give the appropriate signal. Want higher checks — the system will find a way there too. The main thing is to point the direction correctly.
How do planned ROAS values affect results?
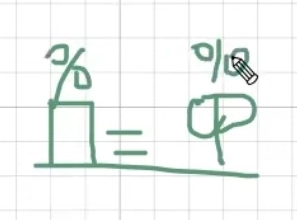
And you point the direction through the planned ROAS value — that ROAS percentage set in the campaign settings. And with this, you need to work constantly. Not set once and forget, but specifically test different values regularly.
Why is this so important? Because Google’s task is to bring actual profitability to the plan you set. This is a basic principle built into any AI system: actual must match plan. You set 500% ROAS — the algorithm will try to hit that number, selecting audiences, products, and bids accordingly.
If your Performance Max has been running for more than a month, you’ve probably noticed: Google constantly suggests lowering the planned value. “We recommend decreasing target ROAS to increase conversion volume” — a typical notification in the interface.
Why does the system do this? It’s simple: most advertisers set the plan too high. And Google — it’s also a business that benefits from you spending more, proportionally giving you results. So the system nudges you again and again: plan lower, lower, lower. And if you blindly agree — actual returns also start falling following the plan.
Here’s a specific example. Suppose you set target ROAS at 800%. The campaign trained and delivers actual 750–820%. Google immediately suggests lowering to 600%. You agree — and in a couple of weeks, actual drops to 580–620%. Another recommendation — now 400%. And so on, until you end up at a point where advertising barely breaks even.
This is why you need to play with planned values yourself, not follow the system’s recommendations. Google shouldn’t manage your advertising — you should manage Google. Try different values, test campaign structures, dig into various bidding strategy settings and watch how system behavior changes. This, of course, sounds crude and simplified, but the essence is exactly this: whoever actively manages the plan gets significantly more from Performance Max than whoever simply trusted automation.
Why do sales drop when switching from “maximize conversions” to “ROAS”?
Imagine the situation: you were working on maximize conversions, everything was going fine — orders were trickling in, you were in a comfortable point on the graph. Then you decided to switch to target ROAS.
Reasons vary: someone watched a YouTube video (maybe even mine) saying ROAS gives better results. Someone listened to a specialist. Or Google itself rolled out a recommendation in the interface. You switched the strategy — and sales plummeted. Not just dipped, but sometimes literally collapsed. For some, even ad impressions drop almost to zero.
Why does this happen? The answer is simpler than it seems: the problem is with the planned ROAS value you set when switching. This is the most common and most critical mistake.
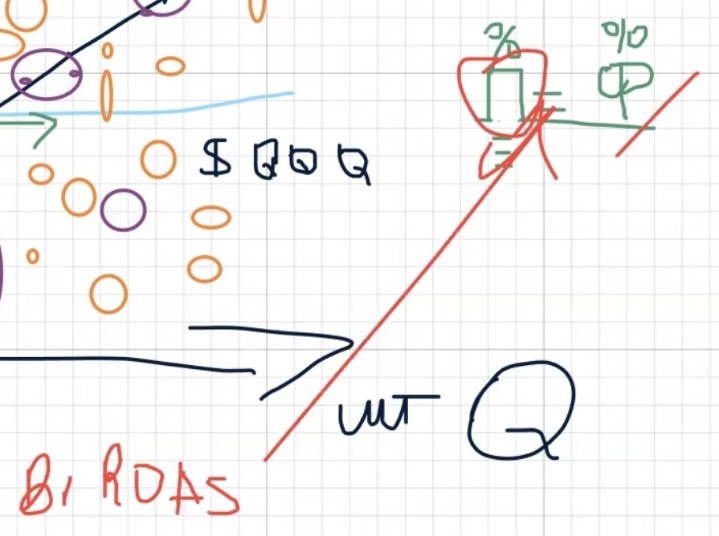
Back when we worked with Smart Shopping, there was a working scheme: calculate Break Even ROAS (the break-even point for profitability) based on the margin you’re willing to spend on advertising, and set this value as the plan. Now in Performance Max, this shouldn’t be done.
Break Even ROAS is still useful — but only as a reference for evaluating actual results. Roughly speaking, to look at the numbers and understand: is the campaign running in the black or in the red. But entering it into the bidding strategy settings as the target value is a mistake that leads to collapse.
Why did the old formula stop working? There are several reasons. Google constantly improves targeting mechanisms, adds new advertising tools, embeds increasingly advanced AI. Auction rules have also changed. Let’s not forget that Google is a huge corporation with its own commercial interests. We don’t control this auction — we adapt to it. And perhaps the main thought of this material is to figure out exactly how to adapt and why many fail to do so.
So, when you switch to ROAS and set too high a plan — for example, that same Break Even ROAS or the value Google recommended — the system simply can’t find enough conversions at that price. Suppose your Break Even ROAS is 800%, and you set exactly that.
The algorithm starts looking only for those users who are highly likely to bring a purchase with eightfold return. There are few such people in the auction, bids have to be lowered, reach narrows — and you get not growth, but a rollback. Conversions don’t just shift to the bottom quadrant — they sometimes disappear almost completely. Impressions drop, clicks evaporate, and along with them, sales in Performance Max.
How to avoid sales dropping when switching to “ROAS”?
To avoid falling into the collapse trap, remember three things that should never be set as your planned ROAS value when switching strategies:
- The value that Google offers you in recommendations;
- Your calculated Break Even ROAS, even if current results satisfy you;
- The actual profitability you were getting on maximize conversions.
Any of these options will most likely run your advertising account aground. The campaign will roll back to the most unfavorable point on the graph and get stuck there for a long time.
So what should you do? When switching from maximize conversions to target ROAS, it’s critically important to correctly determine the starting ROAS value. I’m intentionally not naming specific numbers here — they depend on niche, average check, accumulated analytics, and a dozen other factors. If I name some number, someone will inevitably take it out of context, apply it to a completely different project, get bad results, and write an angry comment. So if you want accurate benchmarks for your business — come for a consultation, we’ll select everything individually.
But I will voice one principle — it’s universal: the planned ROAS value when switching should be significantly lower than the actual you were getting on maximize conversions. Not equal, not slightly less, but noticeably lower. Suppose on maximize conversions you saw actual ROAS of 600%.
If you set the plan at 600% or even 550% — the system will suffocate. But if you set, say, 300–350% (the specific number is selected for the project) and add additional budget — the campaign will likely start moving from the starting point toward that golden mean. And over time — possibly even above it.
From there, everything depends on your pricing and assortment structure. If you want to hit the upper right quadrant of the graph — where both volumes are large and revenue is high — you need to sell products with higher checks.
With identical pricing, you’ll most likely spin in the bottom right quadrant: many units, but modest revenue per sale. The upper left quadrant is expensive orders, but few of them. Each zone has its advantages, but the ideal is movement to the right and up simultaneously.
Important: the described logic works at any business scale. It doesn’t matter whether you have 200 sales per month or just 5 — the graph follows the same patterns. The accuracy of your Performance Max hitting ROAS depends on how well the system understands who to target. Roughly speaking, the AI decides: with what probability will this specific user bring a profitable purchase?
Features of results when working with target ROAS
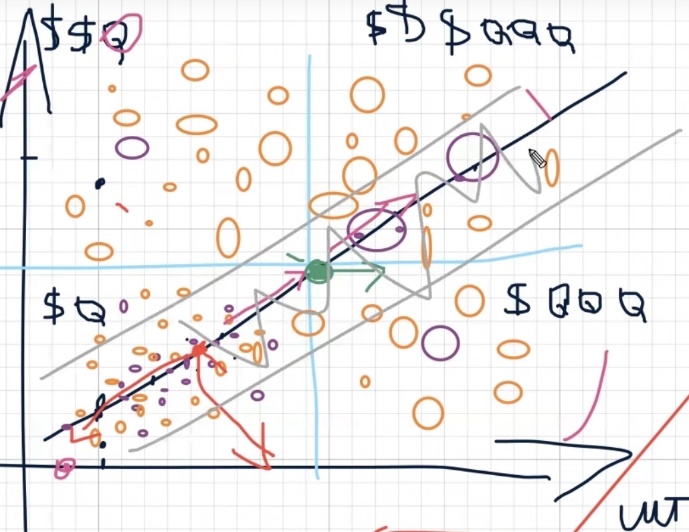
So, we’ve figured out why sales often collapse when switching from maximize conversions to target ROAS. The paradox is that it should be exactly the opposite — ROAS by nature is significantly more flexible. It doesn’t have that rigid linear corridor that maximize conversions is forced to move along. ROAS also moves along this line on the graph, but more like a wave — with variable height and width. And here’s what the parameters of this wave depend on:
- How stably your advertising account generates conversions. If the campaign has been bringing orders for months and the AI has accumulated enough data — the wave will be wide and confident. If the account is young and has few conversions — the wave will be narrow, timid.
- How well the system understands your customer portrait. The more diverse purchases have gone through the account, the better the algorithm understands who to look for.
- Market reach. Launching advertising for Romania with its 12 million population is one story. Targeting Germany or the USA with their 300+ million is a completely different picture. Audience size directly affects wave amplitude and scaling possibilities in Performance Max.
Here’s something fundamental to understand: any automatic bidding strategy — whether maximize conversions or ROAS — when launching first turns to analytics at the account level.
Even if you create a completely new campaign in an old account that already has sales, the AI doesn’t start from scratch. It first analyzes the entire conversion history and uses it as a foundation. This makes sense — why collect data anew when it’s already there?
Unlike the Display Network, where a new campaign can behave completely unpredictably even with identical targeting, the AI in Performance Max knows how to expand this wave, narrow it, change the angle — adapt to the situation in real time.
A separate topic is recommendations from Google employees. When a Googler calls you and suggests “let’s invest 3000 pounds, remove the ROAS restriction — and everything will take off,” it’s worth treating this critically. Or another situation: one Googler says maximize conversions will only work after 50 conversions in the account, while another claims the same about ROAS. Who to believe?
In practice, the number of conversions isn’t a hard threshold. You can perfectly well start with maximize conversions from zero. But if you want to grow and scale — switching to ROAS will eventually become necessary. Even Google itself will nudge you toward this in recommendations.
Why are Google’s recommendations sometimes “off”? Because they’re built on average indicators from a sample. Imagine: Google takes data from conditional Rozetka (the largest marketplace), Prom, Allo, and a dozen small shops with budgets hundreds of times more modest. And derives an average — without removing either maximum or minimum. It’s clear that a recommendation perfect for Rozetka could be devastating for a small online store with 200 items in its assortment.
Does this mean all Google recommendations are useless? No. They’re all useful in their own way — you just need to evaluate each time whether a specific tip fits your project. And target ROAS in any case remains a more voluminous, flexible, and scalable strategy — it knows how to enter different quadrants of the graph and find buyers where maximize conversions simply can’t reach.
The other thing is that the final result in terms of spend and profitability will depend on you personally — on how you accompany and configure this Google advertising tool.
Why you shouldn’t leave settings unchanged?
One of the most common questions: “Can I just launch Performance Max and never touch anything again?” For single niches — perhaps, yes. But if you want to advance along our graph, grow in volume and revenue — static settings will become an anchor.
A simple life principle applies here: want to reach a goal — run toward it. Can’t run — walk. Can’t walk — at least lie facing the right direction. With a Google advertising account, the logic is exactly the same. Without regular actions — adjusting the plan, working with budget, analyzing results — it’s impossible to move from your current quadrant to a more profitable one. Want more units at the same revenue? Take action. Want to raise the average check? Specific steps are needed too. Sitting and waiting for the AI to do everything itself means staying in place.
What happens when switching from “ROAS” back to “maximize conversions”?
The reverse transition — from target ROAS to maximize conversions — leads to roughly the same problem, just from the other side. The wide wave that ROAS had built across the entire graph suddenly narrows. The system starts working again in the narrow corridor of proven paths.
But maximize conversions has one advantage: if the account has accumulated analytics or at least a properly assembled product feed, the strategy quickly finds cheap conversions. This works especially well on starter budgets — 8–12 dollars per day. In such conditions, maximize conversions feels confident and brings first orders.
But if traffic is low or there simply are no cheap conversions in the niche — maximize conversions stalls. Then the only working option is the maximize conversion value strategy (that is, ROAS), with or without a target ROAS limit.
Practical experience using “target ROAS”
Most large projects I work with sit specifically on target ROAS. It provides greater reach: more impressions, more traffic, more clicks — and consequently, more sales. Google employees confirm this with their cases. But there’s a nuance here that few people talk about.
All these cases and Google best practices — real, confirmed by numbers. The question is: whose numbers are these? In the vast majority of cases — American or European advertisers. Large stores that comfortably spend 3000 pounds or dollars per week. For them, such a budget is a working norm, on which analytics is collected quickly and the AI trains in a matter of days.
For small and medium businesses in Ukraine, the picture is completely different. Yes, a Ukrainian store can technically also spend 3000 dollars per week. But they expect proportional results — and they may not come. Especially if you’re just starting: it’s unclear whether the account will collect proper analytics or not, whether you’ll move across quadrants or get stuck in the “dead zone” of the graph. Handing over a large sum to Google at the start without understanding these risks means simply giving money away.
There are extremely few Ukrainian cases in the public space — Google employees hardly use them. And you can’t apply American experience directly: they have bigger budgets, analytics accumulates faster in the advertising account, so effectiveness is higher. The conclusion is simple: filter any Google recommendation through your own reality — your budget, your niche, and your market.
Strategy selection and movement across quadrants
Everything said above doesn’t mean you need to blindly copy someone else’s working model. Your task is to understand which quadrant of the graph you’re currently in, where you want to get to, and what actions to take for this. At the right moment — switch bidding strategies, remove or set target ROAS, move individual products to maximize conversions or vice versa. Both strategies work; neither is “bad” in itself.
Here’s what’s important to consider. If advertising isn’t profitable on maximize conversions, then when switching to ROAS, unprofitability will likely grow proportionally. Yes, you’ll get more units, but revenue won’t increase — you’ll just be selling more products at a loss. So before scaling, make sure you have margin cushion.
The same works in reverse. Suppose on target ROAS in Performance Max you have good returns, but too few orders. You want to grow quantity — jump from the upper left quadrant (high revenue, few units) to the upper right (both high revenue and many units).
All these movements across the graph are possible, but only under one condition: you build from the actual — those real indicators you’ve already achieved — and from the ratio of actual ROAS to your Break Even ROAS. If the gap between them is large and advertising is profitable — there’s room for maneuver. If advertising is already on the edge of profitability — jumping across quadrants will be extremely difficult.
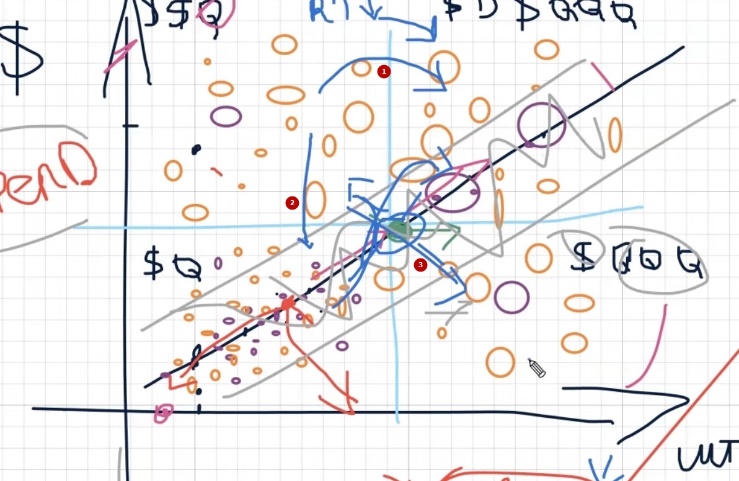
Key principle: first bring the campaign to the golden mean — that green point on the graph where both returns are acceptable and volumes are sufficient. From this point, dancing to any needed quadrant is significantly easier and faster. Moreover, this logic works at any level — for individual price ranges, product categories, assortment intersections. By fractal principle, it scales both up and down.
Now to practice — how exactly to move between quadrants:
- From bottom left to upper right (few units and little money → many units and lots of money). The most difficult route — diagonal direct jumps almost never happen. You’ll have to go in two steps. First option: first grow units (move right), sacrificing profitability, then pull up the average check. Second option: first increase profitability on a small number of orders (move up), then add volume.
- From upper left to upper right (high revenue, few units → high revenue, many units). Here, the problem is most likely solved through campaign budgeting. You may not need to touch ROAS at all — just gradually increase budget and give the system more space to find buyers.
- From bottom right to upper right (many units, little money → many units, lots of money). Here you need to lower your targeting requirements to Google — slightly reduce the planned ROAS value so the system can find buyers with higher checks. But carefully: overdo it — and instead of revenue growth, you’ll get a collapse in profitability. Units will stay the same, but margin will evaporate.
Each such transition requires attention and gradualness. Sharp movements in Google Ads strategy settings almost always end in a rollback to a worse quadrant, not a breakthrough to a better one.
Raw data on quadrants: breaking down a real example
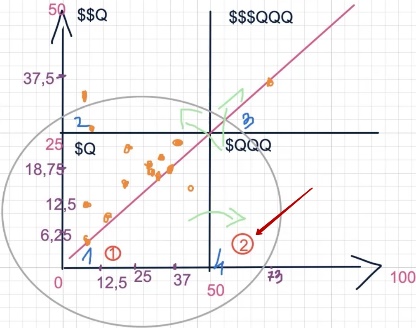
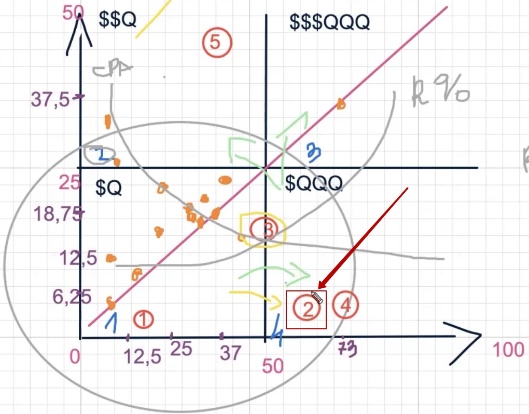
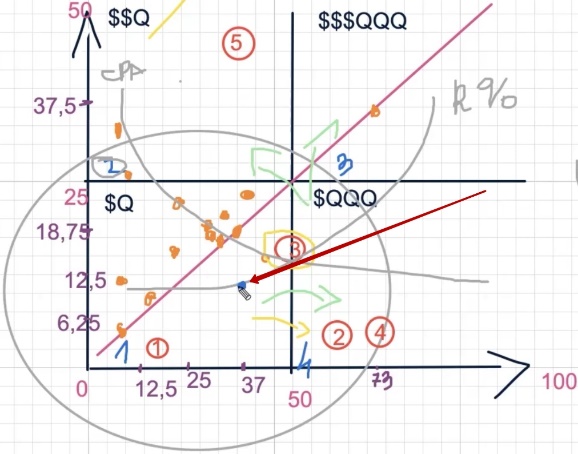
To not be unfounded, let’s transfer real numbers to our quadrant graph. I’ve prepared the same coordinate grid, just neater today. On one axis — number of orders in units, on the other — return on ad spend.
For clarity, I’ve set specific boundaries. On the quantity scale, I took a hundred as a reference because the maximum conversion value in our sample is 73 — nothing higher. The lower threshold I set at 15 conversions — below this mark, data is too scattered and doesn’t form a picture. For profitability, the upper boundary is at 50, since the maximum indicator in the sample is 37.5. If I had taken a hundred here too, the graph would be disproportionate and incorrect.
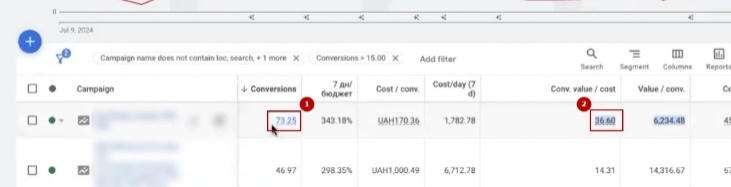
Next — simple mechanics. Take each Performance Max campaign from the account and place a point at the intersection of two values: number of conversions and profitability indicator.
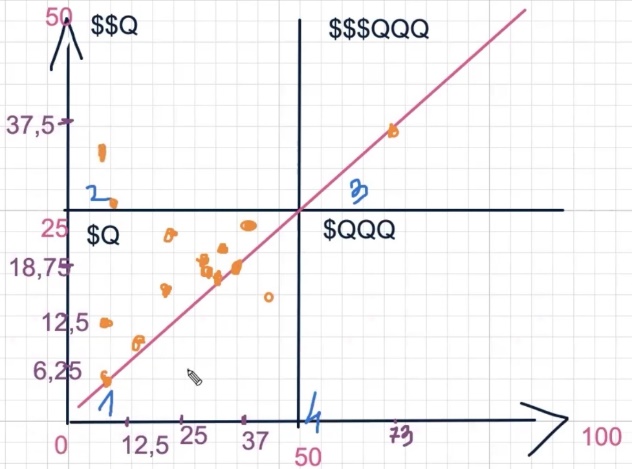
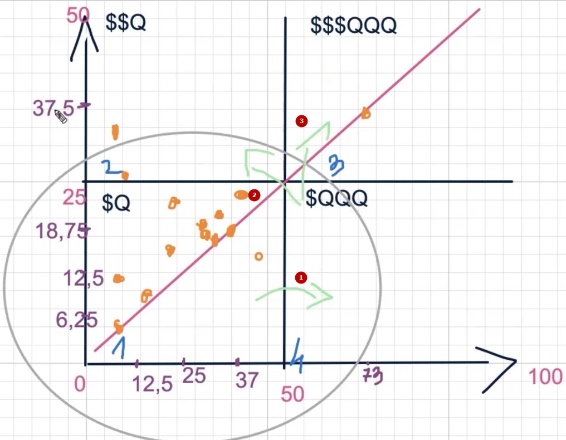
First point — 73 conversions at profitability 36. This is our leader, landing in the upper right quadrant — where both volumes are solid and returns are pleasing. Mark with an orange ellipse.
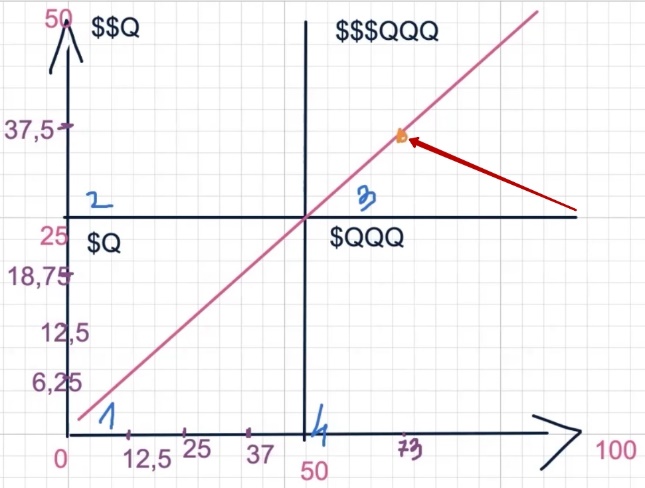
Second point — 46 conversions, profitability 14. Already noticeably more modest: decent units, but Google Ads advertising profitability has sagged. The point shifts down and to the left.
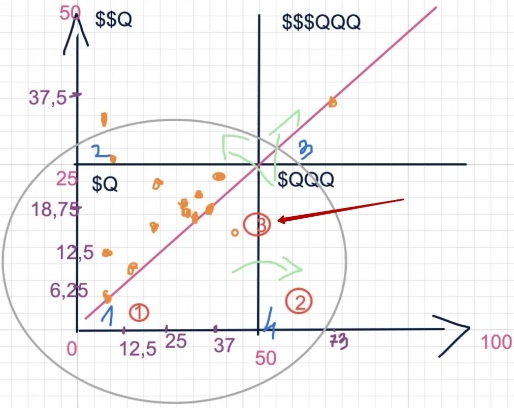
Next, we plot the remaining campaigns by the same principle: 40 and 24, 37 and 15, 33 and 21, 29 and 16, 28 and 17, 27 and 17, 24 and 25, 19 and 14. Each pair is conversions and profitability respectively.
What’s already visible at this stage? Points start clustering. Most campaigns bunch into one zone — roughly 25–40 conversions at profitability 14–25. This is that very “working zone” where the bulk of Google advertising campaigns with ROAS strategy spin.
Now add campaigns with fewer conversions — those below the 15-unit threshold: 13 and 8, 10 and 27, 8 and 6, 8 and 12, 7 and 32.
Notice an interesting pattern: among small campaigns, there are points with very high profitability — for example, 7 conversions at ROAS 32 or 10 conversions at 27. Few units, but each sale brings excellent returns. And there are opposite examples — 8 conversions at profitability only 6. No volume, no returns.
Main conclusion from this visualization: the fewer conversions a campaign generates, the less often it exceeds the lower threshold for advertising effectiveness. Points in upper quadrants become fewer and fewer. This confirms what we discussed earlier — without sufficient data volume, the AI system in Performance Max has difficulty consistently hitting the right zone on the graph.
You can repeat this exercise on your own account — export data for all campaigns and place points on a similar graph. The visualization will show exactly where you are and which direction has potential for movement.
Analysis of plotted data by quadrants
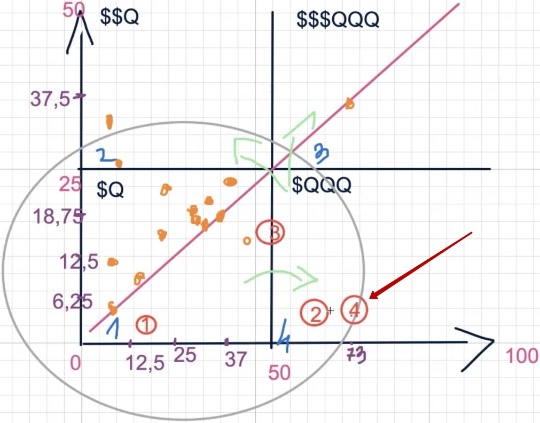
What does this picture give us? If you watched the previous material, you’ll immediately see a familiar pattern — exactly how the maximize conversions strategy behaves in Google Ads. In this account, most campaigns work on maximize conversions, though there are several on ROAS.
But due to modest advertising budgets and small conversion volumes, the picture turns out characteristic: almost all points huddled in one quadrant — the bottom one. This is exactly how I described this strategy’s behavior before. It simmers in a limited zone, grinding through the same audiences and unable to break further.
If you want to scale results, the first logical step is to try migrating right, to the adjacent quadrant where there are more units. It would seem you could first raise profitability and then build volume. But below I’ll show why in this specific case, the client can’t simply do this.
First, you need to grow the number of orders, and only then — from the new quadrant — try to climb up in profitability. Jumping diagonally straight to the upper right corner will be costly because there are several limiting factors.
Yes, the advertising profitability indicators here look excellent — values of 37 and above, which is quite comfortable for most advertisers. But there’s a nuance: some conversions were likely counted incorrectly. I’ve seen situations in reports like 13 purchases from two clicks — a clear signal that analytics is blurred. So treat these numbers as reference points for technical analysis, not as absolute truth.
Product analysis by price segments
Parallel to this, I conducted another analysis that seemed very illustrative — I divided the entire assortment into price segments. Five groups came out, though I could have made more or fewer — I based this on the total number of products. At the time of analysis, there were about 16,000 active positions ready for display in the account.
In orange on the graph, I marked those products that brought at least one conversion — more than zero. Here I should clarify: if you’re familiar with data-driven attribution in Google, you know it counts fractional conversions — 0.3 purchase, 0.01 purchase.
These are so-called longtails that “ripen” in the system for a long time. It’s practically impossible to completely get rid of them. But even if we account for all products that showed at least some hint of conversion (from 0.01 and up), out of 16,000 positions, a very small fraction actually converts.
What does this say? The bulk of the product assortment doesn’t work in advertising at all. And this confirms one of three things: either campaigns are running on very narrow budgets, or the advertiser has no ability to spend more, or it’s a feature of the “maximize conversions” bidding strategy — it chooses proven routes and simply doesn’t reach most of the catalog.
Meanwhile, in the working quadrant, Google advertising campaign profitability looks attractive — but remember that this quadrant proportionally changes its scale as soon as you start moving in either direction.
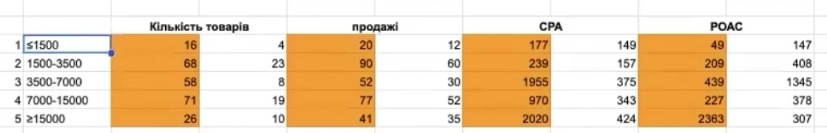
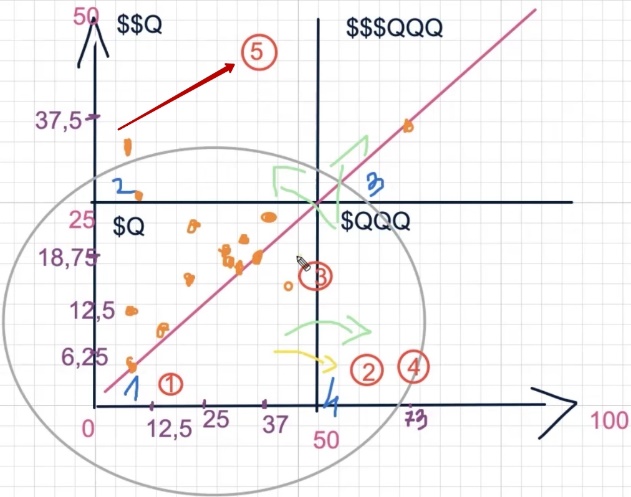
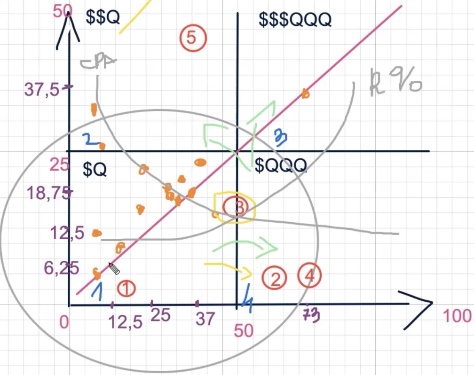
For each of the five price segments, I calculated number of sales in units, cost per acquisition (CPA), and actual ROAS. Numbered them 1 through 5 and plotted on our graph — next we’ll see how each segment distributes across quadrants and where the potential for scaling Performance Max sales is hidden.
First segment: products under $1500
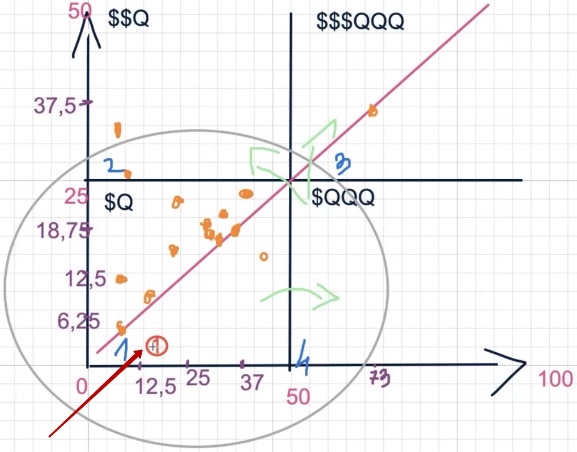
Let’s start with the first price segment — products costing up to 1500 dollars. Where does it land on our graph? Plot the point: about 20 sales for the analyzed period, low cost per acquisition (CPA), ROAS — 49 (that is, 4900% in percentage terms).
It would seem, 4900% — this is a fantastic advertising profitability indicator. And formally this is true, the result is excellent. But we’re analyzing not in a vacuum, but relative to other segments within the same account. And here it turns out there are product groups that give even higher ROAS.
If we plot this “one” on the graph, it ends up in the lower part of the quadrant — closer to the origin. Why? Only 20 sales, and although profitability is decent, in terms of volume this segment is clearly not the leader. Imagine: you sell inexpensive accessories in an electronics online store. They convert okay, margin percentage looks beautiful, but in absolute numbers there’s little money — simply because the check is small and there aren’t enough units.
Second segment: products $1500–3500
Moving to the second price range — from 1500 to 3500 dollars. And here the picture changes dramatically. This segment brought 90 sales — several times more than the first. Plus the ROAS indicator takes second place among all five groups.
On the graph, the “two” lands in the upper right quadrant — where both volumes are solid and returns are pleasing. This is exactly the zone that any Performance Max advertiser strives for. The segment works confidently: the average check is high enough to generate tangible revenue, and at the same time, demand allows gathering a decent number of orders.
Third segment: products $3500–7000
Third price range — from 3500 to 7000 dollars. Here there are 52 sales, and profitability turned out to be average relative to other segments. Neither outstanding nor failing — middle of the road.
On the graph, the “three” lands roughly in the center — not reaching the upper right quadrant, but not sliding into the bottom left either. A kind of neutral zone. Essentially, this segment is at a crossroads: it can become a growth point for scaling sales if the bidding strategy is properly adjusted, or it can remain in the middle, bringing neither outstanding volumes nor record returns.
If we draw an analogy — this is like an employee who works stably but without spark. Doesn’t let down, but doesn’t surprise either. The question is whether it’s worth investing additional budget to shake up this segment specifically, or better to focus on the second one, which has already proven its effectiveness.
Fourth segment: products $7000–15,000
Fourth price range — from 7000 to 15,000 dollars — on the graph is located next to the “three,” roughly in the same central zone. Neither failure nor breakthrough. This segment brings sales, but stands out neither in volume nor in Google Ads advertising profitability. It’s like treading in place, not daring to step either up or right.
Fifth segment: products from $15,000
But the fifth segment — the most expensive, from 15,000 dollars — showed itself interestingly. If you look at the table: 41 sales and high profitability. On the graph, the “five” lands in the upper left quadrant — the zone where revenue per order is excellent, but there aren’t that many orders themselves. A typical situation for expensive products: each sale is “golden,” but their quantity is limited by niche specifics and the size of the audience willing to buy at such amounts.
How to move from the first quadrant to adjacent ones — up or right?
Why am I showing all this? So you can see what resources you can use to roll from your current quadrant to a more profitable one. Which segments will become the “pulling force” for scaling Performance Max advertising campaigns, and which will remain in place.
Let’s start with the “one” — products under $1500. It was in the bottom quadrant and stays there. This confirms what we discussed earlier: relatively cheap product assortment on the “maximize conversions” bidding strategy almost always spins in the first quadrant. Many small units, but without serious breakthrough in profitability.
Can you try to drag this segment into the fourth quadrant — where there are even more units, albeit at moderate profitability? In principle, yes. And here’s why: ROAS 49 (4900%) — is a “low” indicator only relative to other segments within this account. But if compared to average values for the Ukrainian market — this is more than a decent figure.
Suppose the average return on ad spend in your niche across the country is 1500–2000%. And you have 4900% in this segment. So there’s solid margin cushion. You can afford to lower planned profitability, give the system more space to find buyers — and grow the number of orders without going into the red.
The only question is whether your business needs this. If cheap products aren’t a priority, and the main profit comes from segments two and five, then spending budget to shake up the “one” may be inadvisable. Everything depends on your business strategy and what goals you set for Google advertising.
What’s the essence of this material?
The main idea is to show using a real account example that even a simple, schematic analysis allows you to precisely determine how effectively your bidding strategy works — whether maximize conversions or target ROAS. You’ll be able to see which product categories or price segments can become growth points, and what you can realistically use to move from your current quadrant to a more profitable one.
In my example, I built the analysis on average check basis — and it worked. But in your case, it may turn out that price doesn’t play the key role, but rather product typing. In the analyzed account, campaigns are partially split by product type, not by check. For audience targeting, this is an excellent solution. However, for movement across quadrants, these types will likely need to be split even finer — highlighting subsegments and trying to pull at least one of them into the needed zone on the graph.
The quadrant idea itself was born as a way to visually show the mechanics of both strategies. But in the process, it became clear that this is also a working tool for decision-making — where to invest budget, what to scale, and what to leave as is.
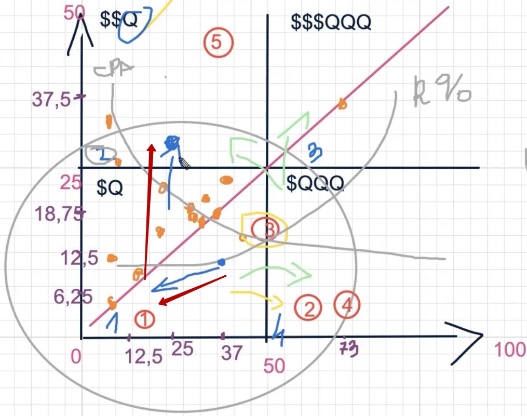
How strategies work when starting with small budgets?
If we overlay both strategies on our quadrant graph, the fundamental difference in movement trajectories is visible:
- Maximize conversions (CPA) when starting with small budgets moves approximately along a descending arc. The logic is: the lower the price per conversion we want to get, the higher the revenue per order turns out — but few units. We want to pay less and earn more, so the starting point is in the upper left corner of the graph. To grow the number of orders and move right, you’ll have to raise the acceptable CPA — that is, agree to higher costs per conversion. But climbing into the upper right quadrant (many units and high revenue simultaneously) using maximize conversions is extremely difficult. The arc simply doesn’t reach this zone.
- Target ROAS moves along the opposite, ascending arc. When you set a high planned value — the system severely restricts itself in impressions and reach. Units and revenue will be proportionally less. As soon as you start lowering the target ROAS — this is essentially the same as increasing the expense side. More freedom for AI — more impressions, more clicks, more orders.
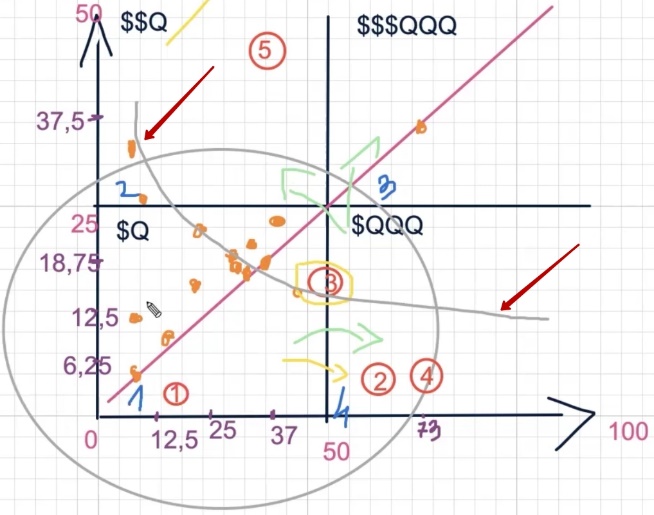
Key point: the ascending ROAS arc is capable of reaching the upper right quadrant — that very zone where maximize conversions hardly gets. The system can hook both the high-revenue zone and the high-volume zone.
But there’s a nuance. If your Google advertising profitability is already on the edge of adequacy — barely breaking even — then jumping along this ascending arc directly will be very difficult.
In such cases, it’s worth acting in stages: first enter the second quadrant (increase profitability on small volumes), stabilize return on ad spend, and only then start growing units. It’s like in sports: if you can barely run a kilometer, don’t sign up for a marathon right away — first build your base, then increase the distance.
Which route to choose — first up, then right, or vice versa — depends on the initial data you’re starting from. There’s no universal recipe, but the principle is one: determine your current point on the graph and move toward the golden mean step by step, not in one leap.
How does average check affect advertising results?
What does average check have to do with all this? The most direct relationship. It’s the price range of products you emphasize that determines what you can use and how easily you can achieve needed results in Performance Max.
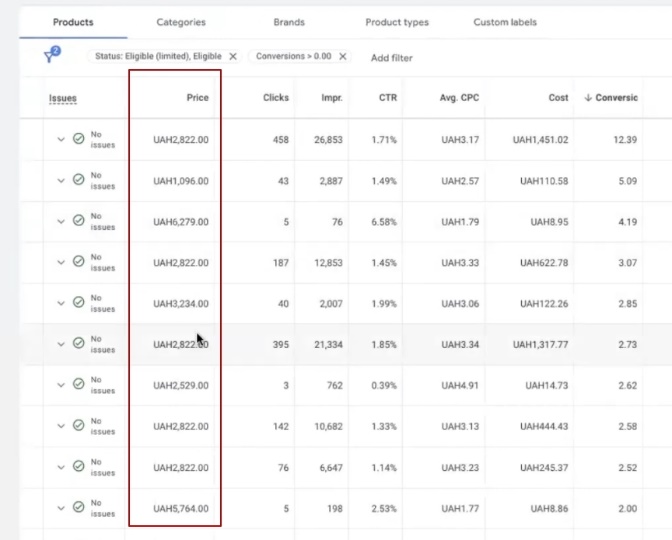
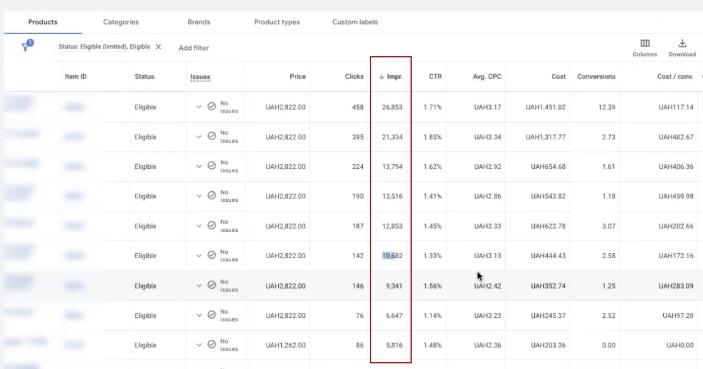
Let me show with a specific example from the analyzed account. Take the campaign that brought the most conversions — the absolute account leader. Go inside, open the product list, and filter by conversions. First set the filter “conversions greater than zero” to see the full picture — including those fractional values of 0.10 or 0.20 that the data-driven attribution model counted.
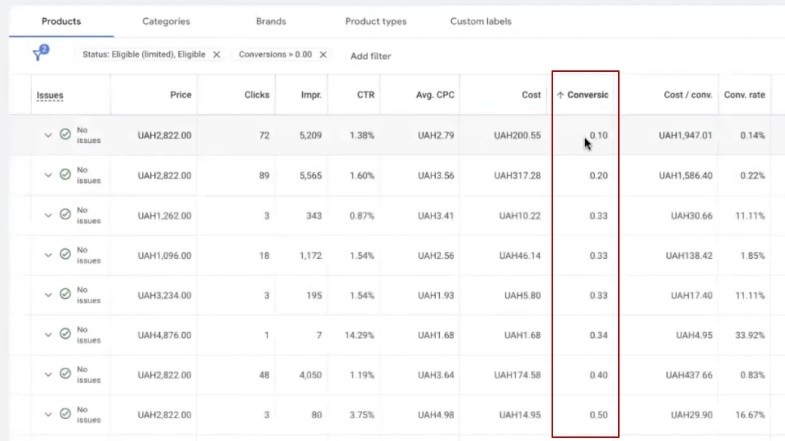
What do we see? Out of the entire campaign assortment, only 45 positions converted at all. And even then, a significant portion are “half” conversions that the attribution model distributed among several products in the purchase chain.
Now let’s break down by price. Filter products with checks up to 1500 UAH — get roughly 10 conversions total. Not much. Switch to the range from 1500 to 3500 UAH — and the picture changes dramatically. Here we get 32 conversions plus some more on top. This is the main sales volume of the campaign. And what about products over 3500 UAH? Set the filter — and see practically emptiness. Almost no conversions.
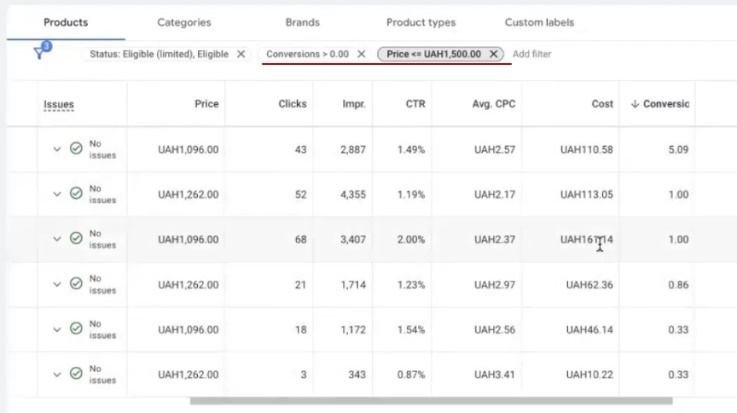
The conclusion is obvious: the average price range of 1500–3500 UAH generates the main revenue in this campaign. This is our “two” on the graph — that very second segment that confidently sits in the upper right quadrant with good volumes and decent profitability. The top Google advertising campaign generates results primarily through this price corridor.
Why do you need to know this? To find your sales generator in your account. Do the same analysis — and you’ll see which price segment pulls the campaign forward, and which simply devours budget. Because it happens like this too: a certain product range actively spends money, gives low advertising profitability, and brings no tangible result. It literally sucks budget from effective segments.
This same logic can be applied not only to price, but to product type. Depending on what exactly you sell and to whom, results will distribute across quadrants completely differently.
Some product type will end up in the fourth quadrant with many units, another will get stuck in the first with single sales. And a third might sit in the second quadrant — with good profitability but small volumes — waiting for you to help it migrate to the third, where there are many units and return on ad spend is at the level.
The quadrant principle is universal: it works equally for analysis by average check, for product assortment typing, and for evaluating individual categories. The main thing is to find your point on the graph and understand which direction to move.
How best to switch to ROAS and what value to set?
So why did I decide to prepare this material with a breakdown on a real example? Because one of the most frequent questions sounds exactly like this: “How do I properly switch to ROAS and what value should I set?” And here I want to clearly articulate the position I’ve confirmed on dozens of accounts.
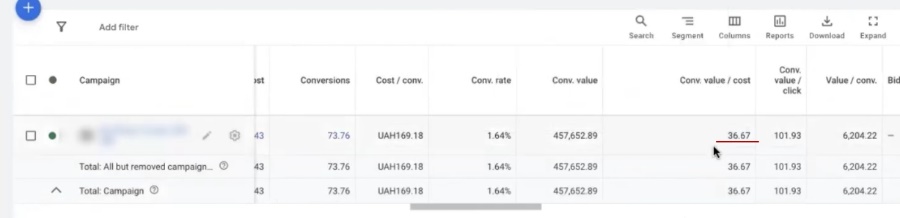
Suppose your maximize conversions campaign shows actual ROAS of 36 (that is, 3600%). It seems logical when switching to target ROAS to set the same 36 or even slightly higher. Well — this makes absolutely no sense. And here’s why.
36 is a weighted average number you see in fact. The system achieved it under maximize conversions conditions, where completely different targeting mechanics operate. If you switch to ROAS and set the same number, one of two things will happen: either you’ll stay exactly at the same point on the graph (then why switch at all?), or — which happens more often — you’ll roll back. The number of orders will drop because the algorithm will have to look for conversions strictly within the inflated plan framework.
Remember our quadrant principle? The whole point of switching to target ROAS strategy in Performance Max is to get the opportunity to cover more quadrants, to scale with benefit. But for this, the planned value needs to be lowered relative to actual, not copied from it.
There are specialists who recommend an even more aggressive approach: after maximize conversions, take actual ROAS and add 20–30% on top. They say this way the system will strive for a higher bar. In practice, for this you’d have to raise the campaign advertising budget several times over to maintain at least some adequate ratio.
The campaign after such a maneuver will adapt significantly longer than usual — the system will start calculating how to even reach such a number, and while it’s thinking, you’ll roll back several steps. Is this critical? No, not fatal. But units will drop noticeably in the first periods, and revenue may turn out disproportionately low.
Specific percentages by which to lower the planned value, I’m intentionally not voicing here. Not out of spite — but because this number depends on niche, budget, accumulated analytics, and a dozen other factors. Every time I name a specific number in public, it starts living its own life: someone rewound, didn’t listen fully, applied to a completely different project — and got the opposite result. If you want an exact number for your account — come for a consultation, we’ll select individually.
By the way, Google employees themselves note this same problem on foreign resources: after switching to Target ROAS, clients massively complain about result drops. And this is unsurprising — Google doesn’t publish a coherent manual on how exactly to determine the right planned profitability value. What does Google write? “Set sufficient budget and give the system time to learn.” How much time? In one manual — a week, in another — four, in a third — six, in a fourth — twelve. There’s no unified standard.
Essentially, Google suggests: give money and wait. For projects with a dedicated test budget — why not, you can try. But the result is 50/50. I’ve seen cases where clients burned through 10,000 dollars on such “learning” and got nothing. And someone with significantly lower costs achieved excellent indicators. It varies each time.
So the main conclusion: don’t set target ROAS in Google Ads equal to or higher than the actual indicator. Especially if the actual is already at a cosmic level like 3600%. Such high numbers are partially the merit of maximize conversions mechanics itself, which squeezes advertising campaign profitability by working in a narrow, proven corridor. Transferring this indicator one-to-one to ROAS means deliberately driving the system into a dead end.
How to conduct a transition test to ROAS?
It’s better to transition to target ROAS not by flipping a switch on the entire campaign, but through testing on a separate assortment — where it’s easiest and least painful to do so.
Let’s break down with our example. The account’s top campaign — 73 conversions, excellent profitability, confident landing in the upper quadrant of the graph. Sounds great, but if you look inside and check impression distribution — the picture isn’t so rosy. Out of 2000 product positions in the campaign, the main impression volume is taken by literally 6–10 products. It’s they who get tens of thousands of impressions, while the others barely breathe.
Take any position with 483 impressions per month and divide by 30 days — you get 16 impressions per day. Will you get many sales from this? Almost certainly — zero. So these very “sleeping” products are ideal candidates for testing. Switching strategy on them won’t harm the account at all, because they practically don’t work anyway.
How to prepare the test:
- Analyze products by types and price ranges, using quadrant logic — determine which product type lands in which zone of the graph.
- Combine product type with price range, because the ROAS bidding strategy always correlates its bids with average check — it directly participates in system calculations.
- For budget products, planned profitability is usually inflated — the system will find cheap conversions anyway. And for expensive positions, it’s deliberately lowered to give them priority in impressions: high check allows spending more on attracting a buyer, there’s margin in conversion cost.
- Launch the test on the selected segment and observe results, instead of simply flipping the switch on the entire campaign at once.
Strategy difference: “target ROAS” vs “maximize conversions”
Target ROAS differs radically from maximize conversions precisely in the scale of possibilities. Maximize conversions works in a narrow corridor — remember our descending arc? While ROAS can roam across all quadrants of the graph.
How profitable the landing points turn out depends on accumulated statistics: what sold more often, which segment gave better returns, which audiences converted. Moreover, the AI inside Performance Max analyzes this picture hundreds of times more detailed than we can do manually — it sees such a volume of data that if we tried to draw it all on a graph, there wouldn’t be a single white spot left.
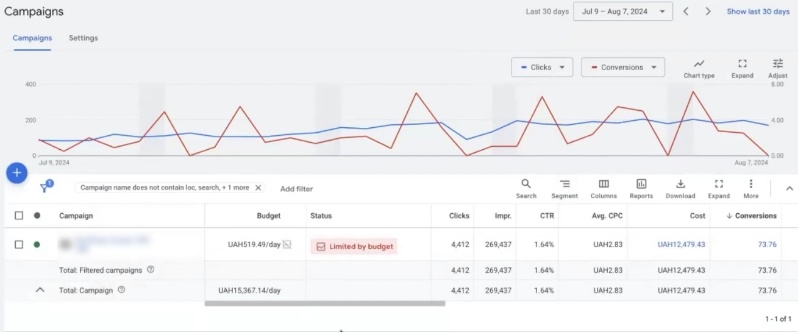
Can you simply flip the switch in an existing campaign? Technically — yes. But most likely the result will disappoint you. Especially considering that even on maximize conversions, the budget-to-CPA ratio in this account isn’t ideal — 280 UAH budget with CPA of 519 UAH.
The thing is, maximize conversions is very sensitive to the proportion between budget size and Google Ads cost per conversion. Want to grow the number of orders — it’s not enough to simply raise acceptable CPA. You need to simultaneously increase the expense side.
On starter budgets of 8–10 dollars, the strategy finds cheap conversions in a certain price corridor. But step beyond its limits — and cost per conversion multiplies by 2–2.5. Instead of 10 dollars, you pay 20–25 for each order.
This is why some advertisers criticize maximize conversions and praise ROAS, while others — exactly the opposite. There’s no universal answer. To understand which bidding strategy in Performance Max will suit you specifically, you need to sit down, break down the account, and look at specific numbers.
Advice for this advertiser
What do I recommend doing in this specific case? Conduct a deeper quadrant analysis, going beyond what I showed. You know your campaigns better than I do — how you set them up, in what sequence you made changes, what product assortment sits in each campaign. Use this knowledge.
At minimum, it’s worth building another quadrant — by product types separately, and then overlay typing on price ranges. Because analyzing simply by check is one thing, and seeing how a specific product type in a specific price corridor distributes across graph zones is completely different.
Unfortunately, I don’t have the ability to sit for hours over each account and derive all these tables — when your eye is trained, you see this picture in your head in seconds. But to convey it visually, additional operations are needed. You can do them yourself. Look at what you can really scale with: at what combinations of profitability and cost per conversion something works better, and what stalls.
There are campaigns in this account that already work on ROAS. Let’s look at one of them — maximize conversion value.
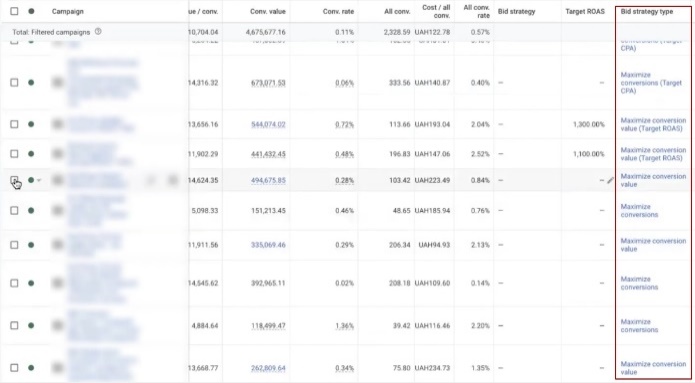
Check the change history for 30 days: bidding strategy wasn’t changed, only budget was adjusted. So the campaign has been stably working on one strategy for some time — just budget was gradually raised. This is a good sign for analysis.
What’s immediately visible? Expenses and cost per acquisition (CPA) here are significantly higher than in maximize conversions campaigns. But at the same time, profitability doesn’t critically sag — holds at a decent level. Why? Look at products inside the campaign, and the answer becomes obvious: average check here is noticeably higher. Even to the naked eye it’s clear that the main conversion volume falls on positions costing from 3500 to 7500 UAH, and in places the more expensive segment pulls up too.
The campaign works without ROAS limitation — and at the same time delivers high ROAS indicators. Where do such results come from? Several reasons:
- First, the account has already accumulated enough analytics and statistics with high profitability, so the transition from maximize conversions to another Google Ads strategy went relatively smoothly.
- Second, the campaign budget correlates well with the product price range — remember, we said that average check directly participates in all system calculations.
But there are pitfalls. There are 5000 product positions in the campaign, and impression distribution among them is extremely uneven — a familiar picture. And here’s what’s important: high profitability here is achieved not through effective targeting, but rather because the product check is simply higher than the expense side. This isn’t a campaign plus — it’s more of its weak point.
Let me show with an example. The system draws a conversion costing 809 UAH, but actually this is 0.65 conversions by data-driven attribution model. This could mean there was one real sale, but its value isn’t 809 UAH, but say, 1336 UAH. If we recalculate: 13,000 UAH revenue divided by 1336 UAH — we get ROAS of 9.7, not 13.99 as the report shows.
The difference — almost one and a half times. And this is a systematic problem of the data-driven attribution model: it splits conversions into tenths and hundredths, smears them across products — and as a result, advertising account analytics turns out distorted.
In one of the positions, I even deducted 13 conversions, because supposedly 13 purchases happened from two clicks. Either one person ordered 13 times (unlikely), or it’s a system artifact. Either way — this isn’t a statistically significant observation, and conclusions can’t be built on it.
Such is the reality of working with Performance Max: beautiful numbers in reports don’t always mean real effectiveness. Before making decisions about strategy change or scaling Google advertising campaigns, take time to figure out — what really stands behind these numbers.
Analysis of changes the client made to campaigns
You need to learn to see this picture whole and determine what to use to move forward. Target ROAS strategy works here — it handles its task. If you try switching to maximize conversions, you’ll likely manage to lower cost per acquisition (CPA), but the number of conversions in units will definitely drop.
To determine what profitability value to set, you need to analyze average ROAS indicators across all account campaigns and try to slightly lower the planned value. By how much exactly to lower — I won’t voice in percentages, because for each account this is an individual story. You need to test, play with numbers, and watch system reaction.
There’s a campaign in the account with planned profitability of 1300%. Let’s see what’s happening with it. At first glance — it’s not performing very actively. The client tries to grow traffic, but results are modest.
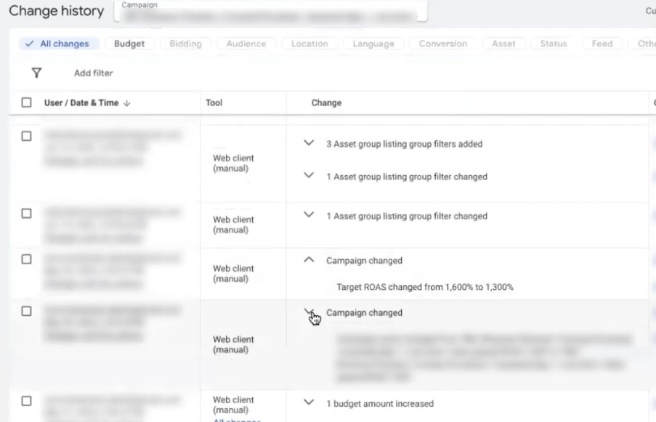
We look at change history. Bidding strategy wasn’t changed — only budget was adjusted. Here’s the chronology: budget raised to 168 UAH, before that it was 140 UAH. And here’s where the main problem lies — for such high profitability values, this is catastrophically small budget. The campaign simply can’t unfold.
Further by dates. May 30 — ROAS dropped slightly. July 10 — some filters were applied, likely excluding part of products. The logic is understandable: if you remove part of the assortment, remaining positions will get a bit more budget and start converting more actively. July 18 — budget cut to 77 UAH per day.
This approach — constantly cutting budget — works equally poorly on both maximize conversions and target ROAS in Performance Max. While you’re treading on such low budgets, nothing will move. You want to pull out 1000% ROAS, but at the same time can’t provide the campaign with even sufficient click volume. Yes, numbers in reports look attractive — profitability is beautiful, CPA seems tolerable. But you’re simply not giving the campaign a chance to grow.
Why does small budget kill results? Here’s another technical point to understand. If you dig into Google advertising campaign settings, you’ll find the “budget delivery method” parameter. In this case, it’s set to “standard.” And standard delivery with a budget of 170 UAH per day is a recipe for stagnation. The system smears these pennies in a thin layer throughout the day and simply can’t gather sufficient data volume for learning.
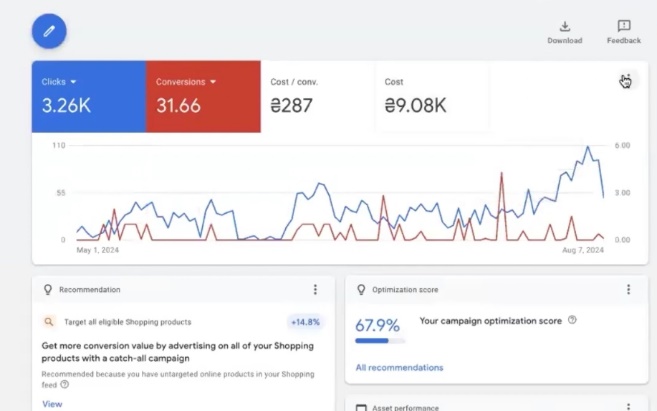
Let’s look at additional metrics. Average cost per click — around 3 UAH. When budget was increased, CPC didn’t rise, and even dropped slightly. At first glance — good, traffic got cheaper. But in practice, this could be a signal that traffic went not quite where needed — the system found cheaper but less targeted clicks. Few sales, so the picture looks more attractive than it really is. The report shows CPA of 286 UAH, but if you go into product breakdown — actual conversion cost turns out significantly higher.
The essence doesn’t change from this: without adequate budget, even the most correct bidding strategy won’t reveal its potential. It’s like trying to accelerate a sports car by pouring two liters of gas into the tank — the engine may be powerful, but there’s nothing to run on.
Project analysis conclusions
Let’s summarize. Here are the main principles worth taking from this breakdown. Test the transition to target ROAS on those products that aren’t the foundation of your working campaigns. Take what barely breathes in your Google advertising account — positions with minimal impressions, tiny conversions.
On them you won’t lose anything, but you’ll get real data on how the strategy behaves in your niche. Once you’ve practiced on “sleeping” assortment — you can try migrating to more active segments.
Target ROAS strategy in Performance Max requires a larger budget — this is a fact you need to accept. Expenses will grow. Increasing acceptable CPA also implies rising costs. But there’s an important nuance here.
Maximize conversions thinks in expense categories somewhat differently — it can fixate at a certain CPA level and not move further. And here’s a typical mistake: the advertiser sees that the campaign makes conversions below target CPA, and thinks — “I’ll raise CPA, the system will start bringing more orders.” But at the same time doesn’t increase budget.
This doesn’t work. If you raise acceptable conversion cost but don’t increase the expense side, you’re not telling the system “spend more and find new buyers.” You’re simply expanding the frame within which nothing changes.
To move forward on our graph, you need to enter new auctions. New auctions — these are new impressions. And new impressions — this is always rising expenses. The only question is how exactly you’ll ensure this increase. There are several options:
- Exclude ineffective products through filters, so budget redistributes to promising assortment;
- Simply increase the campaign’s daily budget;
- Lower the planned profitability value, giving the system more freedom to find buyers;
- Proportionally raise acceptable CPA together with budget, to grow purchased traffic volume;
Which path to choose depends on your specific situation and capabilities.
And one last thing I want to say. There are no ideal profitability, CPA, or budget values that would work universally — for Ukraine, for Europe, for anyone. They simply don’t exist. Every advertising account is individual, however banal that sounds.
And it’s individual not because it’s customary to say so, but because the AI inside Performance Max learns specifically on your analytics. It builds its graphs, its distribution models, its unique behavior patterns — for your assortment, your buyers, your market.
This, in fact, is the main advantage of Performance Max that Google itself talks about: artificial intelligence adapts to each advertiser and helps achieve the results you strive for. But only if you’re ready to test, try, and not be afraid of mistakes.