Hi! My name is Sergey Shevchenko, and I’m a Google logistics specialist. I help businesses find their target audience through Google advertising tools.
Who is this material for and what is its structure?
This post will be primarily useful to business owners and marketers who work (or plan to work) with a Google advertising contractor. Let me clarify right away: this material is not the ultimate truth. If you see that I’ve missed some important points, or if you have ideas for what to add — write in the comments. I’ll take everything into account, and perhaps an expanded second version of this post will come out.
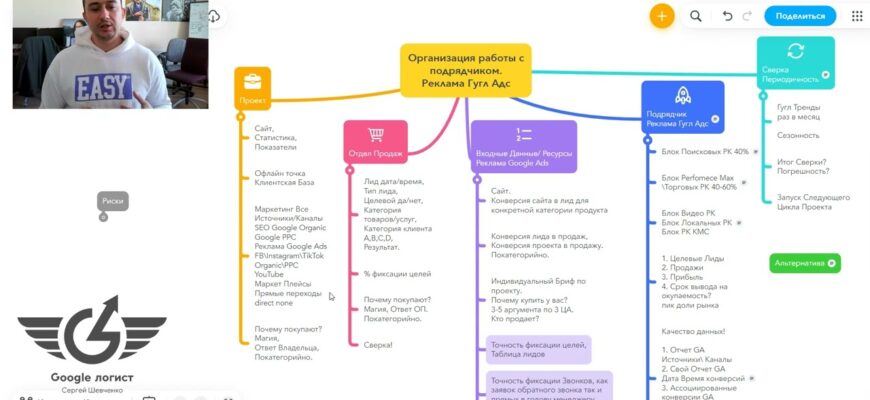
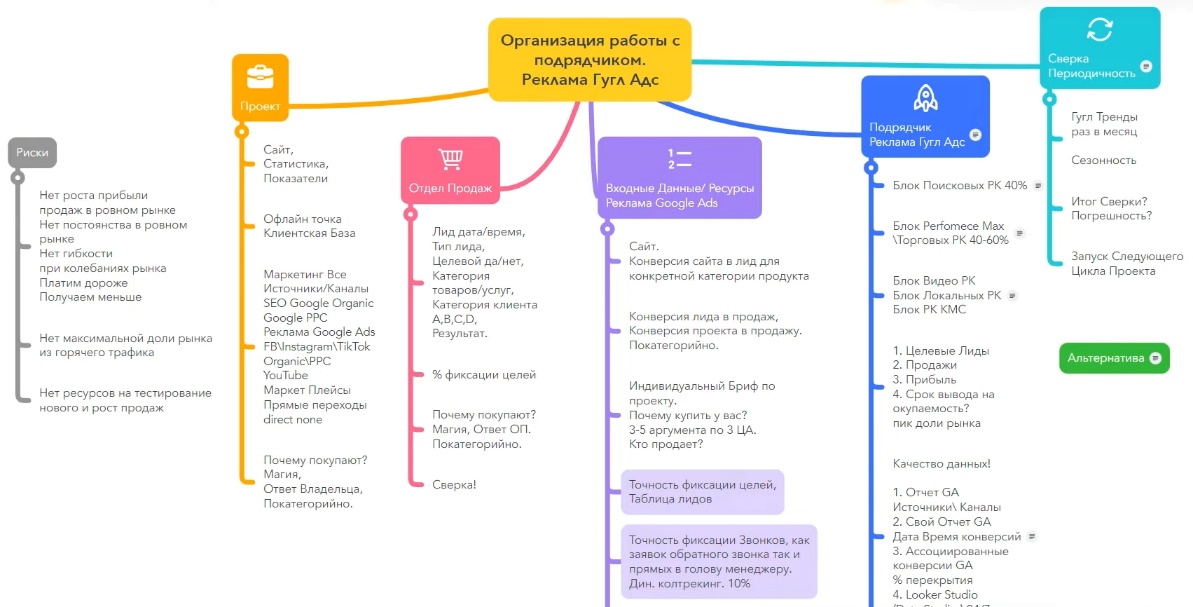
Now about the structure. The material contains several key blocks:
- Project. What already exists in the business before the moment when you decided to launch advertising on Google, improve or scale the current result. For example, you already have a sales department with specific performance metrics — call-to-meeting conversion rate, average check, lead processing speed. All of this is the starting point.
- Input data. I highlight this as a separate block because this is the area of responsibility specifically of the business owner. Input data is what you transfer to the contractor before starting work: information about the product, target audience, seasonality, margin of goods or services. Without this, the Google Ads specialist is essentially working blindly.
- Google Ads contractor and results reconciliation. How to build interaction and, no less importantly — with what frequency to conduct reconciliations? Once a week? Once a month? It depends on the stage and budgets, but more on that later.
- Risks. What will happen if you don’t spend time on all of this? What alternatives are there, and in what situations can the owner really avoid diving deep into the process, and in what situations is it already time to do so?
Important! The role of Google advertising contractor can be filled by anyone: an in-house specialist, a freelancer, an agency, or the business owner themselves who handles this function independently.
And here’s the key point — in all these cases, the scheme for organizing work with a contractor remains relevant. Even if you set up the advertising yourself, it’s useful to understand what input data is needed and to document it.
Why? Let’s say you’re currently running campaigns yourself, but your business is growing, and in six months you’ll hand over the advertising to a specialist. If you already have a system in place — with clear input data, regular reconciliations, documented metrics — the handover will go smoothly, and the results with the new contractor will be better from the first weeks.
Good practice is to run the project through the main blocks of this scheme at least once a month or once a quarter. This way, you’ll find growth points faster and won’t lose control over your Google Ads advertising, regardless of who’s managing it.
“Risks” Block

What risks do you face if you don’t understand how to properly organize work with a Google advertising contractor? Let’s break it down point by point.
No profit and sales growth in a stable market
The market is stable, demand isn’t falling — but sales are stagnant. Why? Because the project isn’t improving relative to itself. There’s no movement from month to month, from quarter to quarter. For example, you sell custom kitchens.
Demand in the niche is steady, competitors aren’t dumping prices — but you’re not reviewing your campaign structure, not updating ads, not analyzing which keywords bring sales and which ones just burn through your budget. As a result, performance freezes even though the market allows for growth.
No sales stability in a stable market
The situation is even more unpleasant: the market is stable, but sales fluctuate — sometimes a lot, sometimes almost nothing. And the most problematic part is that you don’t understand why this is happening. One week you get 20 leads, the next week — 5. Without clear interaction with the contractor, you can’t figure out what exactly is causing these fluctuations: bid changes, audience burnout, analytics failure, or something else. Under these conditions, the business can’t properly plan sales department workload and resources.
No flexibility during market fluctuations
The market is a living organism, and demand fluctuates. And here’s an important principle: the cost per lead and the cost per qualified lead should remain roughly the same, regardless of whether it’s currently high season or low season. The total budget changes — yes, but not the price per result.
Imagine: you sell air conditioners. In summer, demand is high — budget is larger, more leads. In winter, demand drops — budget is reduced, fewer leads. But the cost per lead in both cases should be comparable. Essentially, you’re surfing the waves of demand, reflecting it in good Google Ads campaign efficiency. Without understanding the process of working with a contractor, such flexibility cannot be achieved.
Paying more for results
You simply overpay for results you could get cheaper. For example, the cost per lead is $7.50, but with proper work it could be $4.50. Multiply this difference by hundreds of leads per month — and the amount of losses becomes significant.
Getting fewer sales
This is a separate risk, and it shouldn’t be confused with the previous one. One thing is overpaying for a lead, another is underreceiving their quantity. You might be paying a normal price per lead, but getting 50 leads instead of the possible 120. Cost and volume are different metrics, and both suffer if there’s no proper interaction with whoever is managing your Google advertising.
Not capturing the maximum market share from hot traffic
In 90–95% of cases when launching a project, hot traffic represents the “low-hanging fruit.” People are already searching for your product, ready to buy. Getting the first sales from this segment is the easiest — just take a few correct steps. And this is exactly where the Google advertising team can deliver maximum impact.
But there’s also warm and cold traffic — audiences who are still browsing or comparing. So even what should be relatively easy to obtain algorithmically, you risk missing if you don’t establish proper communication with your contractor.
No resources for testing new things and growing sales
Once a project is running, so-called “star products” and “cash cows” emerge — if we use the classic BCG marketing matrix. A cash cow is a product that consistently brings in money and pays for advertising. A star is a product with high growth potential. The goal is for the cash cow to work like clockwork — predictably and clearly.
Then, based on its turnover, resources appear — 10–15–20% of the budget — for testing new hypotheses, new products and categories. And “dogs” — products that don’t deliver results — need to be cut and the budget redirected to stars. None of this is possible to implement if you don’t understand how to properly communicate with your Google Ads contractor.
That covers the risks block. Let’s move to the next section.
“Project” Block
Every business that comes to Google advertising has a project — regardless of what stage it’s at. Some have been advertising for a couple of years and want to scale, others are just considering their first launch. Regardless of the situation, every project has a set of elements that need to be documented and transferred to the Google Ads advertising contractor.
Website
Launching Google advertising without a website is impossible — this is a basic requirement. If there’s no website, you need to create one. If you have a website — great, but it’s important to understand one thing: the mere fact of having a website doesn’t mean anything yet.
You may have twenty years of offline sales experience and a strong sales department, but if your website pages don’t inspire trust, poorly present the product or service, or lack necessary information — for the internet, your project is essentially a startup. A website is not a business card, but a full-fledged sales tool. Its category pages, product cards, and service pages must be able to sell independently, without help from a manager on the other end of the phone.
Suppose you’re the owner of a dental clinic with an excellent reputation in your city. Patients come through referrals, everything is fine. But on the website — three paragraphs of text, stock photos, and not a single review. For a person from Google search results, this website is no different from hundreds of others. It doesn’t inspire trust, and the conversion to leads will be low no matter how much traffic you drive to it.

Statistics
If the website is already running and receiving traffic — it has statistics. This is your starting point: you see how many people visit, where they come from, how they behave, and what percentage leaves a lead.
If there’s no statistics — that means the website is new and for the internet, your project is essentially a startup. In this case, you need to go through “baptism by fire”: launch Google advertising, accumulate data, and understand how the website interacts with the market and at what cost it can attract customers. For this, plan a test period — two to three weeks, sometimes a month. During this time, we collect initial statistics, analyze, and begin improving.
When there’s no statistics at all, the specialist usually relies on average market indicators for your niche. But this is just a guideline, not a guarantee. Only your own numbers will show the real picture.
Separate point: if the website already has organic traffic from Google — SEO traffic that has built up historically — this is also important to consider. Look at how this traffic converts, which pages sell best. This data will help the Google advertising contractor build advertising campaigns more accurately from the very start.
Metrics
Every project has its own metrics, and it’s important to document them before starting work with Google Ads. What metrics are we talking about?
From the marketing side: website conversion to lead (application or call), cost per lead. From the sales side: conversion from lead to sale. From the technical side: website loading speed, correct operation on mobile devices, functionality of feedback forms.
All of this is the starting point of the project. Without understanding current numbers, it’s impossible to set adequate goals and evaluate the contractor’s performance.
Offline locations
If your project has offline locations — a store, beauty salon, pizzeria, pickup point — this definitely needs to be considered. First, connect each location to a Google Business Profile. Make sure the information on Google Maps is up to date: address, phone, business hours, photos.
And a separate important task — reviews. Make sure your customers leave positive reviews on Google Maps. Ask them to do this after a purchase or service.
Good reviews directly influence the trust of new customers and advertising effectiveness. The topic of creating selling reviews deserves separate analysis — if you’re interested, write in the comments and I’ll prepare material on how to create reviews that actually work for sales.
Customer base
A customer base is not mandatory for starting Google advertising. You can advertise successfully without it. But when you have one — it’s an additional resource that affects the structure of the Google Ads advertising campaign.
For example, you have an online store of children’s products with 5,000 customers in your base who purchased in the last year. Based on this base, you can launch remarketing campaigns, create look-alike audiences, and more accurately target advertising to people with similar behavior. These are different campaign types and a different approach to setup.
So at minimum, indicate in the brief for the contractor that you have a customer base — its size, what sources it was collected from, how current it is. Based on this information, the Google advertising contractor will suggest specific advertising campaign types and recommend how best to utilize this base.
Paid Google advertising
A large and key block that we’ll divide into two parts. First — input data for Google Ads advertising. Second — the actual work of the Google advertising contractor. We’ll go through each of these parts in detail in the following sections.
Facebook, Instagram, TikTok
If social networks are involved in the project — Facebook, Instagram, TikTok — this also needs to be considered. TikTok currently works well both in the US and Ukraine, although questions about possible platform restrictions periodically arise. While it’s available — it makes sense to work with it.
From social networks can come both paid traffic (targeted advertising) and organic — subscribers, viral reach, reposts. All of this affects the overall picture of the project and how to structure Google advertising campaigns.
Organic traffic
Separately, we document what organic traffic the project already has. SEO traffic from Google, visits from social networks, mentions on forums or blogs. If the website is already receiving organic visits — it’s important to understand which pages work better, where people come from, and how they convert.
This helps the Google advertising contractor distribute the budget more accurately and not duplicate what already works well for free.
YouTube
YouTube is a tool I pay attention to in every piece of content, and for good reason. It delivers several effects simultaneously.
Suppose you sell interior doors. Record 15–20 short videos answering typical customer questions: “Which material is better for humid spaces?”, “How is veneer different from eco-veneer?”, “How to properly measure a door opening?”
What this gives you:
- First, trust in the company and brand increases — people see real people and understand who they’re buying from.
- Second, conversion grows on product or service pages where video is embedded.
- Third, you make the sales department’s job easier: managers don’t need to repeat the same thing to every client — just send a link to the video.
- And fourth, YouTube videos appear in Google’s zero position — when for a specific query, the search engine shows a video fragment with a timestamp right in the search results.
One YouTube video works in several directions at once — use this.
Marketplaces
If you’re already selling through marketplaces — Etsy, Prom, Rozetka, Horoshop — and sales are coming from there, and now you want to additionally launch Google advertising, that’s great. But you need to clearly understand how to separate traffic flows and analytics.
For example, a person saw your product on Prom, then googled your store name, went to the website and bought there. Is this a sale from the marketplace or from the website? Without proper analytics, you won’t figure out where customers really come from, and risk making wrong decisions about budgets. We’ll talk more about how to separate all of this later.
Direct visits to website (Direct / None)
In any project, there’s a share of direct visits — when a person enters the website address directly into the browser. Where do they come from? There are many sources: store signage, business cards with QR codes, offline events, recommendations from acquaintances, bookmarks in regular customers’ browsers. Even competitors on the market who periodically monitor your website — these are also direct visits.
All of this needs to be considered when analyzing the effectiveness of Google Ads campaigns. If you don’t separate direct traffic from advertising, the picture will be distorted. Say, you see sales growth and think it’s the advertising’s merit, but actually the number of direct visits increased after a successful exhibition. Or vice versa — the advertising works well, but direct visits dropped, and in overall statistics it seems like nothing changed.
Why do people buy from you?
The last, but one of the most important elements of the “Project” block. Every business must have a clear answer to the question: “Why do customers buy specifically from us?” Not abstract “we have good quality and reasonable prices,” but concrete meanings for each category of products or services.
For example, you sell custom furniture. Why do people buy kitchens? Because you make a free 3D project in 24 hours. Why do they buy sliding wardrobes? Because you use Austrian Blum hardware and give a 10-year warranty on mechanisms. These are different answers for different categories.
The owner’s task is to sit down and write out these meanings. A marketer will help structure and format them, but they can’t extract the essence for you. Only you know why customers return and recommend you to others. If this work isn’t done — do it before handing the project to a Google advertising contractor. Without these meanings, neither ads nor landing pages will work at full strength.
That covers the main elements of the “Project” block. The topic is extensive, and we could dive deeper into each point, but we’ve covered the key things.
“Sales Department” Block
Every company has someone who processes leads. This could be a full-fledged sales department with a manager and a team of salespeople, one hired employee, or the owner themselves. The format isn’t as important — what matters is that this function exists and directly impacts the results of Google Ads advertising.
Let’s figure out what information from the sales department is needed for the Google advertising contractor to effectively manage the advertising account.
Typical situation: the owner comes in and says: “We get 50 calls per week, 20 sales, average check is such-and-such. We want more — let’s get more leads.” Sounds logical, but this isn’t enough for proper work. We need answers by category: how many of these 50 calls are qualified, and how many are junk? For which products or services did they inquire? Why do some buy and others don’t?

To get this picture, we ask the sales department during the first month (or better yet, the first three months) of work to document information for each lead in a table. Here’s what should be there.
Lead date and time
Every inquiry should have a clear date and time — down to the minute. Why? This allows us to accurately determine where the lead came from: from a Google advertising campaign, from organic search, from Facebook, or from a marketplace. Without time-stamping, we can’t match the data with Google Analytics and prove that a specific lead is the result of a specific advertising channel.
Separate point: if your project operates in multiple countries — for example, you’re located in Ukraine but sell to Germany or Canada — be sure to account for time zone differences. Otherwise, the data won’t match up.
Lead type
How did the client reach out? This could be a direct call to the manager’s number, a callback request, a quick order on the website, a paid order, an email, a form submission, or completing a quiz form.
For example, you installed a quiz on your website — “Calculate your kitchen cost in 2 minutes.” A person completed it, and the result went to the manager’s email. This is a lead from a quiz form, and it needs to be marked exactly as such. Why is this important? Because different lead types have different quality and different conversion rates to sales. An order with payment on the website is one thing, while an email that Google Analytics might not track at all is completely different.
Is the lead qualified or not?
After the first three to five minutes of conversation, the manager already understands in 90–95% of cases whether they have a qualified client in front of them or not. This answer needs to be recorded: yes or no. Simple and clear. This is a basic filter that allows us to calculate the real cost per qualified lead, not the overall cost of all inquiries combined.
Product or service category
Which direction did the client inquire about? If you sell kitchens, sliding wardrobes, and walk-in closets — you need to record which specific category the lead came from. This information allows for more efficient distribution of the advertising budget: you see that kitchens deliver qualified inquiries at ₴150, while walk-in closets at ₴400, and make an informed decision about where to direct more funds.
Client category
Here’s a simple classification:
- Category A — “hot” client. They have money, they have a need, and they’re ready to buy right now. These typically represent 10–15% of the market. The manager just needs to not interfere — simply process the request professionally.
- Category B — the main bulk, about 70% of inquiries. These people came to the right place, they’re interested in your product, they have money. But they don’t have an answer to: “Why buy now rather than wait? And why buy specifically from you?” This is exactly why the sales department exists. The task is to provide convincing answers. Some answers should already be on the website (reviews, case studies, guarantees), and some — in the managers’ scripts.
- Category C — people who reached out in the right niche, didn’t make a mistake, but they’re “not your client.” Maybe they don’t have the budget, maybe they don’t fit other parameters. Approximately 10–15% of the total flow.
- Category D — junk leads. Non-qualified inquiries that, with proper classification, fall into this category.
Result
And the final point — how did the conversation with the client end? Commercial proposal sent, client declined, sale completed, follow-up communication scheduled. A specific result for each lead.
All this information — from date and time to final result — is critically important for effective management of a Google Ads advertising account. When we have a complete picture for each inquiry, we can accurately determine where the lead came from: from a new Google advertising campaign, from organic promotion, from social networks, from a marketplace, or if it was a direct website visit. Without a leads table — just guesses and feelings. With it — numbers you can rely on.
Goal tracking percentage
Ultimately, it’s important to understand how completely the sales department records all inquiries. This is exactly why the leads table is needed — to match data from Google Analytics with actual applications.
A separate story — leads via email. In some niches, 5–10% of inquiries come through email, and Google Analytics might simply not see them. This is especially characteristic of the B2B segment: industrial water purification, oxygen and nitrogen generators, soundproofing, design services, warehouse and pallet racks, mezzanines. The specifics of such niches are that clients often prefer to write a detailed email rather than fill out a form on the website.
And it’s through email that often the most “valuable” leads come — Category A. For example, you sell warehouse equipment. There might be only two or three email inquiries per month, but each one is for hundreds of thousands of hryvnias. If these leads aren’t recorded in the table, you lose critically important information for analysis.
One such lead won’t show the big picture, but when 5–10 inquiries accumulate — you can already analyze: what time do applications come in, from which pages, for which queries. And based on this — scale results through Google advertising.
Why do they buy?
We’ve already discussed that the business owner should formulate an answer to “Why do people buy from us?” for each product or service category. But there’s a nuance — the sales department sees the situation from a different angle.
The owner typically thinks broadly and describes the full spectrum of niche advantages. Meanwhile, managers who communicate with clients every day can supplement, narrow down, or deepen these points with specific examples. Say, the owner writes: “People buy from us because of quality materials and good service.” And the manager adds: “80% of clients say they chose us because of free same-day measurer visits — with competitors you wait three to five days.”
So ideally, when filling out the brief to start work on Google Ads advertising, involve the sales department in the process. Let the managers expand on the owner’s points, add profiles of real clients and typical buying scenarios. This information is invaluable to the Google advertising contractor — based on it, both ad texts and advertising campaign structures are built.
Reconciliation
And the last, but critically important point regarding the sales department — participation in results reconciliation. This is an area of responsibility not only for the marketer and Google advertising contractor, but directly for the sales department as well.
Managers are obligated to maintain lead data with quality. Without accurate recording — or at least without understanding the margin of error in the data — any analytics loses meaning. You can build a perfect Google Ads advertising campaign, bring in qualified traffic, but on the sales department side the data is kept haphazardly: leads recorded without time, categories not marked, half the inquiries not entered into the table at all. In this case, the work is only half done, and full reconciliation becomes impossible.
“Input Data. Resources for Google Ads Advertising” Block
So we’ve reached the point where the owner or marketer formulates the request: “We want to launch Google advertising — what do we need to prepare for a quality start?” Let’s break down what input data will be needed.
Website
We’ve already talked about the website in the “Project” block — it must exist, it must work as a sales tool, and it must have baseline metrics documented. This is the starting point for everything that follows.
Website conversion to lead for a specific product category
Each product or service category on the website has its own conversion rate — how many visitors out of a hundred leave an application or call. This metric needs to be known. If it hasn’t been determined yet — then it needs to be tested, and time should be allocated for this: one, two, three weeks depending on traffic volume.

Suppose you sell windows and doors. The conversion rate for the windows page might be 4%, while for the doors page — 1.5%. These are different numbers, and they directly impact lead cost and budget planning in Google Ads. Without this data, the Google advertising contractor will be working blindly.
Lead conversion to sale and project conversion to sale
This is where the sales department connects. What percentage of leads do managers convert into actual sales? This is an averaged indicator of application processing quality.
Let’s break it down with numbers. 100 people visited the website. Three of them called — website conversion to lead is 3%. Of three calls, the manager closed one sale — sales department conversion is 33%. And project conversion to sale is 1% (one sale per 100 visitors).
For many online stores, 1% conversion to sale is a quite workable metric. In some niches, even 0.5% is considered normal, from which you can earn. But everything depends on the specific niche, country, and product category. The main thing is to know your numbers, not to rely on others’.
Category-by-category analytics
A critically important point — don’t mix everything together. If you have 5–10 different product categories or service directions, analyze each separately. Separate, as they say, the wheat from the chaff.
Imagine: you have a plumbing store. Average website conversion is 2%. Seems okay. But when you break it down by category, it turns out that toilets convert at 4%, faucets at 3%, and shower cabins at 0.5%. Without this separation, you’d never find the problematic category. But this way — just from properly framing the question, you can lay in 10–20–30% efficiency growth in each category separately. Be sure to transfer this analytics to the Google advertising contractor.
Individual project brief
Before starting work, an individual brief is filled out. And the key questions in it are those related to positioning: “Why buy specifically from you?” Practice shows that weak answers to this question are the main reason why projects work at zero or with minimal profit. Advertising brings people in, the website collects applications, but the client doesn’t understand how you’re different from dozens of competitors — and leaves.
Why buy from you (3–5 arguments for each target audience profile)
This is the million-dollar question, and it’s worth approaching seriously. Ideally, you should have 3–5 clear, strong arguments for “Why buy specifically from you?” — and not abstract ones, but tailored to each target audience profile.
What does this give in practice? Project conversion to sale can grow from 0.5% to 1.5%. You pay the same amount per click in Google Ads advertising, but lead cost and sale cost drop threefold. Without exaggeration — this is one of the most powerful levers in a project.
How to get there? Start with one — the most desirable, most profitable client profile. Suppose you’re an online English school. Don’t try to be “courses for everyone.” Become an English school for A2–B1 level, tailored for IT professionals and entrepreneurs. Write out 3–5 specific arguments for this audience: “Conversational format from the first lesson,” “Teachers with experience in the IT field,” “Flexible schedule for irregular workdays.” Power up the page with these marketing meanings, acquire clients.
And then something interesting will happen: when you’ve found strong arguments for one segment, other categories will start pulling up. Practice shows that it’s precisely the deep development of one direction that creates the foundation for scaling Google advertising campaigns to new audiences.
Who is selling?
Often you visit a website — and it’s unclear who stands behind it. A faceless brand, faceless product, not a single living person. Yet people want to buy from people. This isn’t a new trend — it’s been gaining momentum for a long time. It’s important for the client to understand who’s on the other side of the screen: what values the founder holds, how they came into their business, what they do better than others, what they’re praised for.
These simple things directly impact project conversion, yet they’re regularly neglected. Especially guilty of this are offline businesses with years of experience. An owner comes in with 15 years in the niche behind them. Made a business card website — and stopped there. But you start talking to them — and within 20 minutes you understand that behind the project stands tremendous expertise. Only none of what they told you appears on the website — not even five percent of it.
What to do? Record three or four videos where the owner tells: how they came into this business, why clients choose their company specifically, what they do best, what brings people in through referrals. Post on the website, on the YouTube channel. This doesn’t cost much money, but sharply increases trust and website conversion to sale.
The answer to “Who is selling?” is indirectly another powerful argument for “Why buy from you?” I’ll give an example from my own experience. I have a blog on paid Google advertising that’s considered one of the best on the market in Russian and Ukrainian language spaces. On the YouTube channel — more than 200 useful videos that people actually use and give feedback on. Business owners order training for their specialists to find project growth points. More than half of clients are from Europe, the US, and Canada. There’s experience with B2B projects, complex personalized services with large checks.
When a potential client sees this — not just words, but a real blog, real videos, real reviews — their internal “lizard of distrust” diminishes. The person understands: at minimum, the work will be done at a good level. And they’re already interested in moving to the next step of communication.
The same in your project. Help people choose specifically you. Show who stands behind the business, give them the opportunity to “feel” your expertise before the first contact with a manager.
Goal tracking accuracy and leads table
Among all input data for the Google Ads advertising contractor, there are three blocks without which we don’t start work with potential clients. And the first of them is the sales department’s readiness to maintain a leads table. We talked in detail about its contents in the “Sales Department” section.
If the company already has a CRM system — excellent, use it. But in the first month of work (and depending on the service package — the first three months), we ask to duplicate information in a separate table. Why? To understand with what accuracy and in which product category the data is collected. When after one to three months we see that the data can be trusted at 80–85%, and the margin of error is understood and predictable — duplication can be removed.
In terms of labor costs, this is minimal: entering one lead takes an employee from one to two minutes. If 10 inquiries come in per day — that’s 10–20 minutes of work. Not much for the ability to clearly see where clients come from, what quality they are, and how the Google advertising campaign performs. The main thing — make sure the sales department actually enters this data, rather than forgetting after a couple of days.
Call tracking accuracy (dynamic call tracking)
If more than 10% of inquiries in your project are direct calls to the manager’s number listed on the website, then starting work with a Google advertising contractor without dynamic call tracking makes no sense. You simply won’t understand what you’re paying for, because a significant portion of results won’t be reflected in analytics.
How does it work? Dynamic call tracking replaces the phone number on the website for each specific visitor. A person came to the site from a Google Ads campaign — saw one number. Another came from organic search — saw a different number. A third came from Facebook — a third number. When any of them calls, the system (for example, Ringostat or Binotel) accurately determines where this person came from and sends an event to Google Analytics.
Thanks to this, separate goals appear in statistics: website application, cart order, callback button call, and call to the dynamically replaced number from the website header. You get a clear answer to the “Lead type” question — what we discussed in the “Sales Department” block.
Why is this critical? Imagine: 30% of your hottest clients — those ready to buy right now — call directly to the manager’s number. Without call tracking, Google advertising algorithms don’t see these conversions. The system sees the ad impression, sees the click, but doesn’t see the call. For it, this user is no different from hundreds of others who just browsed the site and left. As a result, the algorithm cannot learn from the most valuable clients and bring in similar ones.
Suppose you sell industrial equipment. A client saw Google advertising, went to the website, studied the catalog, and called the manager — ordered a batch for ₴200,000. An excellent Category A lead. But without call tracking, for the system this call doesn’t exist. The algorithm doesn’t get the signal that it should look for similar users. Changes made by the Google Ads setup team also don’t account for this lead. You lose both data and the ability to scale results.
If calls are less than 10% — you can manage without call tracking, the margin of error won’t be critical. But if more — install it mandatory. This is an investment in data accuracy, proper algorithm training, and the ability to bring higher-quality clients for larger checks at lower costs.
Ability to make changes on the website
The third mandatory block, without which there’s no point in starting. You need readiness to promptly make changes on the website. This is input data not in the form of numbers, but as a resource: “Yes, we can. If needed to improve Google advertising or the project as a whole — we’ll make the changes.”
At minimum — the ability to quickly change text content on pages. The Google Ads advertising contractor’s team writes new texts for landing pages, formulates stronger headlines, adds “Why buy from you?” arguments — and you promptly place this on the website after approval.
Technical improvements — loading speed, mobile adaptation — don’t always depend directly on you. If the site is on Shopify, Prom, or Horoshop, some parameters are limited by the platform. But what is in your control zone should be resolved quickly.
Separate point. If you’re launching Google Shopping campaigns, the quality of product data is critically important: complete descriptions, correct prices, quality photos, proper categories. There must be readiness to supplement and improve this information.
Time to resolve bottlenecks
This point I would highlight as a separate resource, because in practice this is where projects often get stuck.
When the Google Ads advertising team starts work, tasks inevitably arise: supplement the data feed, fix text on a landing page, add a new application form, set up a goal in analytics. Each such task is a “bottleneck” that stalls the project until resolved.
For example, the specialist sees that a category page loads for 8 seconds on mobile — half the traffic leaves before loading completes. Or the Google advertising algorithm recommends adding ad extensions with specific advantages, but these advantages aren’t on the website. Or you need to add microdata for proper operation of shopping campaigns.
All these things aren’t the contractor’s whims, but direct influence on system training. The faster you resolve the bottleneck — the faster algorithms learn to bring quality clients for larger checks and cheaper. It’s especially important to control the speed of resolving such tasks in the first week and first month of work — this is when the foundation for the entire project’s efficiency is laid.
So we’ve covered three major blocks: “Project,” “Sales Department,” and “Input Data” for the Google advertising contractor. Just framing questions according to this structure shows what’s missing in the project and what needs to be tightened up for quality results.
“Google Ads Advertising Contractor” Block
We’ve reached the key stage — directly creating and managing Google advertising campaigns. Let me remind you who can act as contractor: in-house specialist, freelancer, agency, or the business owner themselves who allocates part of their time to handle weekly technical tasks for advertising. Any of these options works — the main thing is to understand the process structure.
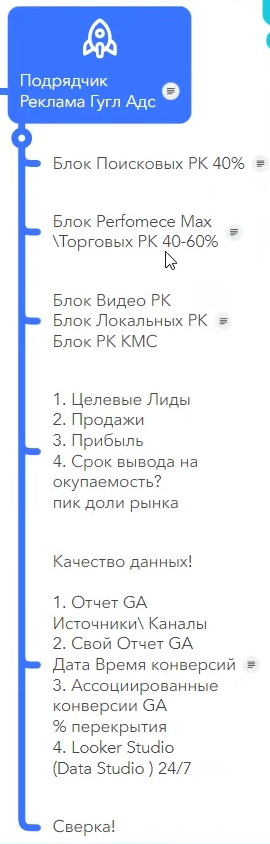
Search advertising campaigns block
In a developed Google Ads advertising account, search campaigns can account for a significant share of sales. For online stores, this is usually 20–50% of total volume. For the B2B segment — from 60% up to 80% of all sales. Search is the foundation, and it’s worth approaching it systematically.

Structure by categories
The first thing to discuss with the team is how the search advertising campaigns structure is built and by what categories they’re divided. This directly impacts account management quality and reporting convenience.
Ideally, advertising campaign names should reflect their content and be built according to clear logic. The business owner should be able to ask a simple question: “How did category X perform on branded traffic?” — and get a clear answer without digging through the account.
For this, search campaigns are divided at minimum by three dimensions: brand-model traffic (when a person searches for a specific brand or product model), queries with identified need (when a person searches for a problem solution, for example “apartment soundproofing price”), and geo-dimension (division by regions or cities).
Each of these dimensions intersects with product categories. Suppose you have three main categories — that’s 3 dimensions multiplied by 3 categories = 9 Google advertising campaigns. Each campaign name includes suffixes and prefixes that allow quick data filtering. For example: “Search_Brand_Kitchens_Kyiv” or “Search_Need_Wardrobes_All_Ukraine.”
What does this give in practice? First, convenient management right within the account — filter by prefix and see the needed slice. Second, easy data extraction to Looker Studio (formerly Data Studio), personal Google Analytics reports, or any other visualization system. Third, at any moment you can view the percentage of received impressions by each segment and understand what market share you’re currently capturing.
Separate point: it’s not always worth fragmenting campaigns into maximum detail. For example, in Performance Max, too fine slicing can harm algorithm training. There are cases when it’s better to combine several categories into one campaign. This depends on data volume, budget, and niche specifics — there’s no universal recipe.
Percentage of received impressions for hot queries
An important metric to track is the percentage of received impressions on hot queries and queries with identified need. For this segment, the benchmark is 80% and above.
Why exactly this? Hot queries are those “low-hanging fruit,” people who are already ready to buy. If you’re only showing on 40–50% of such queries — you’re giving half of hot demand to competitors. At the same time, sales from such queries should be profitable for the business.
If the website cannot convert visitors from the hottest search queries — this is a signal to return to working out answers to “Why buy from you?” and “Why buy now?” The problem isn’t in Google advertising, but in the landing page or offer.
Lead cost and qualified lead cost
Naturally, the key metrics for any Google Ads advertising campaign are lead cost and qualified lead cost. And here again, the leads table maintained by the sales department comes to the forefront.
When you have the date and time of each inquiry, and in the Google advertising account — data on clicks and conversions, you can match a specific lead with a specific advertising campaign. Not in 100% of cases, but approximately 70% of the time you can accurately determine which specific campaign brought the client.
For example, you see: a call came in at 14:32, and at that time a click on an ad from the “Search_Need_Kitchens_Kyiv” campaign was recorded at 14:28. With high probability — this is that very lead.
Such detail is worth its weight in gold for improving efficiency. You don’t just know the overall lead cost for the account, but see which specific campaigns bring qualified clients, and which generate junk traffic. And based on this, make decisions about budget reallocation.
Performance Max and shopping advertising campaigns block
Performance Max isn’t just a tool for online stores. It can be used for the B2B segment and for services too. The campaign shows ads in Google search results (with image and price), on partner sites of the display network, and also learns from leads that came in earlier. That’s why it’s so important to record all conversions, including direct calls to the manager — the algorithm uses this data to find similar clients.
Essentially, Performance Max partially replaces several tools at once: multi-level remarketing, display network on similar audiences, and search for clients similar to those who already made a purchase. How well it does this depends on how it was trained and what data was fed to it.
An interesting tool, but requiring attention. Previously for online stores, Google Shopping worked simpler and more understandably. Now instead of it — Performance Max, and you need to understand how to manage it. There are projects where it works excellently, and there are cases where you have to work on retraining. I have more than one video on this topic on my channel with analysis of specific cases.
Separately worth mentioning are shopping advertising campaigns — a tool that appeared before Google Shopping. It only works for online stores, but it has strong sides, and it’s worth combining in parallel with Performance Max. Such a bundle often gives better results than each tool separately.
What share of sales does this block provide? For online stores, the Performance Max and shopping campaigns block can provide 40 to 60% of all sales from Google Ads advertising. And importantly — these are typically the cheapest leads and sales on the market. Search campaigns are usually more expensive.
Therefore, if your online store is just starting and is a new project for the internet — start specifically with Performance Max and shopping campaigns. Refine sales on this tool, make the project profitable. And only then connect search campaigns, display network, local campaigns, or video advertising. This sequence reduces risks and allows faster reach of profitability.

What to control? As with search campaigns, structure is important here. But benchmarks for percentage of received impressions are different. If for hot search queries we aim for 80%+, then for Google shopping campaigns 20–40% of received impressions is a quite adequate result. The specific number depends on how well the product feed is filled and what audience the algorithm is looking for.
Key metrics remain the same: lead cost and qualified lead cost. This is an intermediate, but critically important result of the Google advertising team’s work specifically from the Performance Max and shopping campaigns block. Not just “sold for such-and-such amount,” but how much does one lead and one qualified lead cost from a specific campaign type. It’s by these metrics that efficiency is evaluated and scaling decisions are made.
Video advertising campaigns, local campaigns, and GDN block
These tools are connected when the project has already reached profitability from search campaigns and Performance Max. The foundation works, brings in money — now you can develop and expand reach.
Such campaigns are launched for specific target audience profiles. You can start with one main profile, then expand to two or three. The main thing — don’t blur the audience, but clearly understand who and what you’re showing to.
It’s important to understand the key difference of these tools from search. If from Google search campaigns conversion usually comes within 1–3 days, and from Performance Max — sometimes in just hours, then video advertising and display network work with a delayed effect.
The client maturation period can be several weeks. A person saw your video, remembered it, thought about it — and only returned two to three weeks later and left an application. Therefore, here we necessarily account for assisted conversions, not only direct ones.
If we talk about YouTube, one of the most interesting tools is sequential video showing for a specific target audience profile. It works like this: you create a chain of several videos, and each subsequent video will only be seen by those who watched the previous one. The second — only those who watched the first. The third — only those who watched the first and second. You can build a chain up to 5 videos.
Essentially, you move the audience through a maturation funnel: from forming need — to warming up — to sale — and even further, to recommending to friends and acquaintances. This is a powerful tool for niches with long decision cycles.
A separate and very interesting strategy is attracting people who are at the stage of preceding need. They’re not yet searching for your product directly, but by all indicators are highly likely to become interested in it soon.
Suppose you sell wallpaper. A person who is currently interested in wall plastering will most likely, at the next stage, be choosing a finish coating — wallpaper, decorative plaster, or painting. They haven’t yet typed in Google “buy wallpaper,” but by their behavior you can see that need is forming. You show them a video with advantages of specific wallpaper — inexpensive per view, unobtrusive, with emphasis on solving their task. If the cost per lead from such an audience is acceptable — you scale.
For the testing block — video, GDN, local campaigns, experiments with new audiences — ideally allocate 10–30% of the project budget. The specific share depends on results: if tests show good returns — you increase. If not — you reallocate back to the main campaigns that earn. The logic is simple: the main Google Ads advertising block ensures profit, while the testing block develops the project and finds new growth points.
Qualified leads. Sales. Profit. Time to reach profitability
The output of the Google advertising contractor’s work is qualified leads and sales. And here we return again to the leads table — without it, it’s impossible to clearly answer what share of results is generated specifically by paid Google Ads advertising.
Suppose the website brings $100,000 in sales per month. Of these, paid Google advertising generates $55,000 or $70,000. When you have a leads table and correct analytics, you can determine with 90–95% accuracy what profit the invested money brings — both in traffic and in the team’s work. These aren’t feelings anymore, but numbers you can rely on.
One of the key parameters of working with a Google advertising contractor, rarely discussed at the start, is the time to bring the project to profitability. It directly depends on the team’s level.
The difference can be substantial. With an experienced team, the path from launch to profitable project takes, conditionally, two months. During this time, main categories are tested, the website is checked, market feedback is received. Of five categories, two took off — they became “stars” or “cash cows.” Three didn’t take off — but already in the second month changes were made: marketing packaging was reworked, one category was saved, two were replaced with new ones. The project moves forward.
With a beginning specialist or freelancer, the same path might take six months. Not because the person is bad — just less experience, less exposure, more trial and error.
Here’s an example: an online store of floor coverings — good offline sales, decided to go online. Launched, and then Google blocks Merchant Center. With a beginning specialist, unblocking might drag on for three months.
An experienced team, which has unblocked hundreds of such accounts, will write even before launch: “Add this information here, change the wording here, add this page.” The probability that Google Ads Merchant Center moderation will go smoothly is significantly higher. Yes, perhaps a week of programmer work will be needed — but that’s a week, not three months of downtime.
Therefore, when signing a contract with a contractor, allocate time for such situations: the ability to promptly make changes on the website, to reduce the probability of blocking, so that the first four weeks of Performance Max work cleanly, goals are recorded correctly, and the project accumulates data for training.
What are the options? There are several solution paths. You can hire an experienced team or agency — more expensive, but faster results. You can work with a freelancer — cheaper, but longer. You can manage Google advertising yourself — and additionally order a one-time paid consultation from a specialist with extensive experience, to get direction and avoid typical mistakes.
There are plenty of options — the main thing is to remember that time to reach profitability exists as a parameter, and it directly affects how much money you’ll spend before the project starts earning.
Data quality
The key parameter at the output of a Google advertising contractor’s work is the quality of data they provide. But it’s important to understand: data doesn’t appear by itself. It’s formed in combination — the advertising team, marketer, and sales department. If one link underperforms, the picture will be incomplete.
What specifically does “data quality” mean? It’s the ability to match what the Google Ads contractor sees in the advertising account with what the sales department records in the leads table. For this, three basic reports are needed.
Report 1: Traffic sources and channels in Google Analytics
A standard report showing where visitors come to the website from: paid Google advertising, organic search, Facebook, direct visits, marketplaces, and other sources. This is the general traffic map — the starting point for any analysis.
Report 2: Breakdown by lead types with date and time
Here you need a custom report in Google Analytics where separate columns are displayed for each lead by inquiry type: cart order, one-click order, callback request via popup button, call to replacement number via dynamic call tracking, quiz form completion. These are different lead types, and they need to be separated.
For each inquiry, a specific date and time is recorded down to the minute. Why? To match output data from the Google advertising team with sales department records and get an answer to the question: did this specific lead come from advertising — yes or no? If not — from where? From Facebook, from organic, direct visit from a regular client, or something else?
Report 3: Assisted conversions
This report shows the percentage of overlap between different advertising channels. The fact is, the client’s path to purchase is rarely linear. Before ordering, a person might have 3, 5, or sometimes even 12 touchpoints with the website through different channels. First saw an ad in Google advertising, then came from organic, then returned through remarketing in Performance Max — and only then bought.
Assisted conversions give an answer about what percentage of sales each channel participated in. For example, out of 100 sales, 70 were directly brought by Google Ads advertising. But it also participated in chains of another 5% of sales that formally came from other channels — organic, Facebook, direct visits. And vice versa — other channels participated in overlap with advertising. Understanding this overlap percentage is important to neither overestimate nor underestimate the contribution of each traffic source.
How does this look in practice?
For our clients, we output all this information to Looker Studio (formerly called Data Studio). This is an online dashboard, available 24/7 — the owner can open it on their phone at any moment and view statistics on sales, Google advertising campaign types, product categories. Everything is visual and in real time.
Additionally, from these reports we get the percentage of discrepancy between actual data and recorded goals, the share of each channel by traffic, and the share of channels by leads. This allows seeing the complete picture: where Google advertising works efficiently, where there are gaps, and which channels complement each other.
Preparation and analysis of this data is just as important a stage as the sales department’s work. Both sides must understand: time spent on reconciliation is time invested in the growth of the entire project.
“Reconciliation” Block
We’ve covered all the main blocks — project, sales department, input data, contractor work. Now the penultimate, but very important block — results reconciliation. When and how often to conduct it?

Reconciliation frequency
Frequency depends on the project stage. If it’s the first launch of Google Ads advertising, or you’ve hired a new contractor, or redesigned the website, or made substantial changes to goal tracking — for the first week we look at data daily. You as the owner, the marketing team, and the Google advertising contractor — everyone controls the process every day. This is a critically important period when you need to ensure that goals are recorded correctly, data is collected properly, and nothing is “flying past” analytics.
The following three weeks — we move to weekly control. Once a week check the main metrics: are goals being recorded, do analytics data match real inquiries, are there any anomalies.

Later, when the project has stabilized and there are no substantial changes — it’s enough to conduct reconciliation once a month. At this stage, you already understand that data can be trusted at 85%, and you factor in a 15% margin of error. If significant changes suddenly appear — you return to more frequent control.
Google Trends analysis and seasonality
Once a month or once a quarter, it’s useful to check Google Trends. This tool shows demand dynamics over the last five years and allows you to predict what awaits the project in the coming months.
For example, you sell air conditioners. You look: April of this year compared to April two years ago — demand grew by 20%. Adjusting for current dynamics, you forecast how May will behave: whether to increase the Google advertising budget, whether the warehouse is ready for order growth, whether the sales department has enough capacity. This allows you not to react to seasonality post-factum, but to prepare for it in advance.
Reconciliation results and margin of error
The reconciliation results should have specific conclusions. Sales department data — reconciled with Google advertising contractor data. Goal information — checked and confirmed. Margin of error percentage — calculated and recorded.
Suppose the first two weeks of the Google Ads advertising campaign have passed. You conducted reconciliation: out of 50 leads that analytics shows, the sales department confirmed 43. Seven are discrepancy: two turned out to be test applications, three weren’t recorded in the leads table, and two came from organic rather than advertising. Now you know the margin of error and can account for it in future calculations.
Launching the next project cycle
All reconciliation isn’t for its own sake — it prepares the ground for the next cycle. Based on collected data, strategic decisions are made: which categories to scale, which campaigns to restructure, where to reallocate budget.
Important point: strategy cannot be changed every day. There’s a block of weekly technical tasks that need to be performed in the account regularly. But cardinal changes in strategy are made only after accumulating sufficient statistics — usually after two weeks or a month for a specific type of Google advertising campaigns. Then there’s argumentation, basis, and data for making a decision.
“Alternative” Block
Finally — an important question: is it always necessary to dive into all these blocks? No. There are situations when an owner shouldn’t spend time on this right now.
Suppose you have a YouTube channel with expert content, or an article in Google organic search that hit the top positions. In it, you detailed how to approach choosing an industrial water purification installation, showed prize-winning places at European conferences, demonstrated expertise. People come in, read thoroughly — and immediately want to order. Sales are growing by themselves.

In such a situation, there’s no need to stop and dissect every block. Satisfy the demand, adjust Google Ads advertising campaigns to the growth, increase sales. The only thing worth doing right now — ensure that data is being collected correctly: dynamic call tracking is working, the leads table is maintained, goals in Google Analytics are set up properly. Because the particularity of analytics is that you can’t pull data retroactively — if a goal wasn’t set up, the information is lost forever.
When in three to six months you hit a plateau and want to grow again — you’ll return to these questions. You’ll have accumulated statistics for the entire growth period, and the marketing team together with the Google advertising contractor will be able to unpack the reasons for success: where clients came from, which channels worked, which audiences turned out to be most valuable. Based on this data, you can assemble audience lists in Google Analytics and Google Ads for launching remarketing or look-alike audience search — and reach a new growth cycle.
And if right now there’s no time to dive in — delegate these questions to a marketer. You’ll return when you need to increase the efficiency of what’s already working.
That covers the main blocks. If questions arise or you have something to add — write in the comments. Perhaps later an expanded second version of this material will come out. Have a good day and effective Google advertising campaigns!