Competitor analysis in contextual advertising
Imagine how much easier it would be to do business if you were the only player in your niche. Unfortunately, such a scenario is highly unlikely, and today competition in all areas of activity is intensifying significantly.
Competitors enter the market, grab their share of customers, make a profit, and invest it in promotion. That is why today, in order to stay afloat and increase their efficiency, businesses need to regularly analyze their competitors in contextual advertising.
How can analyzing a competitor’s contextual advertising help?
- If you regularly analyze your competitors’ contextual advertising, it will help you understand:
- What and where they promote. For example, with the help of analysis, you can discover a new promising promotion channel that you have not used before. You will also be able to assess the potential of Google Ads for your niche and discover potentially profitable products that your market competitors advertise.
- What search queries are used. This will allow you to add new relevant phrases to your semantic core, exclude ineffective keywords, or focus on long-tail queries (they have less competition, and clicks on them are usually cheaper).
- Which creatives get the most response from the audience. The analysis will show what benefits they focus on and what bonuses they offer to buyers. Pay particular attention to the calls to action and USPs they use in advertising and on landing pages. This will help you create higher quality and, most importantly, clickable ads.
- How to find and fix your own mistakes. If your advertising is working but you’re not getting many calls or sales, your competitors can show you how to fix the situation. Analyze their campaigns — this will help you understand which techniques work well and which creative elements are best to use to get more orders from advertising.
- What is their approximate budget for promotion? Although Google does not provide the opportunity to find out the exact advertising budget of competitors, approximate figures can be seen. To estimate this, you can use average rates for the niche and the semantic core that competitors use for promotion.
- Is their strategy changing? If you suddenly notice that one of your competitors has radically changed their approach to promotion, this is a clear signal of a new trend or changes in the market. For example, a new advertising tool has appeared, or new products have been added to the promotion. In such cases, it is extremely important to react quickly and make adjustments to your own marketing strategy.
What should be considered when analyzing competitors’ advertising campaigns?
- Semantic core. When analyzing competitors’ advertising campaigns, be sure to pay attention to the keywords they use in their promotion. You may find inexpensive keywords with high conversion rates that you have not used in your campaigns before.
- Advertisements. Each one is a treasure trove of useful insights. If you are just starting to work with contextual advertising, analyzing other people’s texts will help you find effective wording and increase the clickability of your ads. Study ads not only in your region — see what advertisers in other cities and countries are showing. This will help you understand how to strengthen your own texts, how to hook your audience, and how to avoid clichéd wording. When auditing, pay attention to the USP and positioning of your market competitors. Check what quick links they add to their ads. Compare their creatives, texts, and calls to action with your own. What other advertisers overlook can become your competitive advantage.
- Headings and descriptions. Analyze patterns: which headings appear frequently and which rarely, how competitors compose descriptions, which calls to action they prefer. The insights you gather will help you write compelling texts that won’t get lost among dozens of similar ads. For example, you may discover an important product advantage that others ignore for some reason, even though it is important to buyers. Or you can offer more favorable terms than other market players.
- Extensions and add-ons. The extensions used can give you an idea of industry standards: whether it is customary to include a phone number, which sections of the site additional links lead to, whether other advertisers show prices directly in the ad. Study all types of extensions and highlight the most popular approaches — this will show you what your audience expects.
- Competitive advantages. In addition to extensions, analyze the descriptions and highlights in ads. What are other advertisers focusing on? What product features do they emphasize? What do they leave out? Competitors often ignore the real problems of buyers — you can fill this gap by simply shifting the focus in the text. If everyone else is emphasizing delivery, installation, quality, and design, then price, durability, production times, free project development, and consultations remain in the shadows — use this to your advantage.
- Landing pages. The effectiveness of a landing page directly determines the number of orders and the bounce rate. Even an excellent ad will not help if, after clicking on it, the user is taken to a page with a vague offer — how can you expect to make any sales? Find elements that encourage people to buy. Evaluate the design, content, and call-to-action buttons. Pay special attention to relevance — how accurately the page responds to the visitor’s request.
- Target audience. Determine who other players’ ads are aimed at and how much this audience overlaps with yours. To do this, study creatives, USPs, and landing pages—they will tell you more about your buyer persona than any research.
How can you find out your competitors’ budgets?
Since many different factors influence pricing in contextual advertising, it is impossible to find out the exact budget of competitors in Google Ads. However, this does not preclude the possibility of determining the approximate costs of competing companies. Knowing how much they pay per click, you can compare this indicator with your own and understand which display strategy is more appropriate to use—focusing on high-frequency queries that are expensive, or cheap low-frequency ones.
You can calculate a competitor’s budget when auditing specific keywords as follows:
- Create an Excel sheet and add all the necessary competitor keywords;
- Sort data by number of impressions, cost, and position;
- Identify the number of clicks for each keyword;
- To determine the approximate CTR (click-through rate) of a competitor, compare it with the CTR of your advertising campaign for the same queries. If you ranked higher for these keywords, reduce the indicators for the competing company slightly, and vice versa.
- Based on the click-through rate found using a simple formula in Excel, we calculate the number of clicks:
Clicks = Impressions * CTR
- Next, we find the budget for this keyword by multiplying the number of clicks received by the cost per click.
- We summarize the data and obtain the total budget that another website spends on the analyzed keywords.
How to analyze competitors in Google Ads?
Don’t expect competitors or Google to reveal their secrets and show their cards. The reality is that you will have to search for and gather information piece by piece from various sources, combining data and drawing conclusions.
Let’s take a look at the main tools and platforms that will help you conduct a comprehensive analysis of your competitors in Google Ads.
Keyword Planner
This is an internal service from Google, available to every advertiser at no additional cost.
This tool allows you to:
- Discover new keywords. For example, if you sell sneakers, the tool will suggest related queries such as “running shoes with cushioning” or “sports shoes for the gym,” which you may not have thought of.
- Automatically filter out irrelevant queries based on an analysis of the content of your website and others. The system will determine the subject matter itself and remove words that do not correspond to the selected niche.
- Set up the geography and language for keyword selection — from an entire country to a specific city. Here you will also see the potential reach: how many people use Google in the selected region. For example, for an online store in Kyiv, you can find out the exact number of users in the Ukrainian capital.
- Check out detailed stats for each query: average monthly searches, how demand has changed over the last quarter and year, how competitive it is, and the minimum and maximum bids per click. This info will help you figure out your budget and decide if it’s worth going after specific keywords.
- Export all information to a CSV file or Google Sheets for further processing. This is useful when you need to analyze a large data set or share the results with your team.
Auction statistics
This report appears after launching an advertising campaign in Google Ads and reveals the full picture of competition: who is bidding on the same keywords, how actively they participate in auctions, and how often they beat you in the battle for impressions.

Let’s figure out what information can be extracted from “Auction Statistics”:
- List of direct competitors for selected queries. You will see all domains that compete for the same keywords — both for individual phrases and for groups of keywords. For example, if you sell laptops, the report will show that Rozetka and Allo.ua also compete for the query “buy a laptop for work,” which indicates high competition in the niche.
- Percentage of impressions received. Shows your share of the total number of possible impressions for a certain period of time. If your site has 30% and another site has 60%, the latter gets twice as much traffic for these queries. This indicator clearly shows your current position in the market.
- Overlap rate. Shows how often your ads appeared at the same time as your competitor’s ads. A high percentage (e.g., 70%) means that this advertiser is your main competitor, and you are constantly competing for the attention of the same audience.
- Percentage of positions above. Shows the frequency with which competitors outperformed you in search results when appearing simultaneously for the same queries. If the figure exceeds 50%, it means that your competitor regularly occupies more advantageous positions — you should review your bids or improve the quality of your ads.
- Shows above organic search results. Reflects placement in special placement (the first 4 positions above free results). This is an indicator of the overall quality of campaigns: if you have 80% and your competitor has 40%, your advertising is more effective and more often appears in the most clickable places.
- First position impressions. This is the percentage of cases when your ad occupied the top position in the ad block. This metric helps you understand whether higher cost-per-click rates are paying off.
- Win rate. Summarizes how often your ads outperformed competitors on a combination of factors and received more impressions. A high value (70%+) indicates a sustainable advantage, while a low value is a signal to optimize your campaigns.
Advertising Transparency Center
This tool allows you to look directly into your competitors’ advertising strategies — you will see their actual ads in all formats and on all platforms. Just enter the company name, and the system will show the entire history of its advertising campaigns (however, ads through agency accounts are not displayed, so the tool is only suitable for analyzing direct advertisers).
Standard commercial ads are stored in the database for one year, while political ads are stored for seven years. Please note that unverified advertisers are not displayed in the system, and new ads may appear with a delay of up to three days, as they require some time to process.
The Transparency Center reveals a wealth of details: the appearance of competitors’ ads, the total number of active campaigns, placement sites, and formats used—text blocks, banners, or videos.
For an accurate search, use the built-in filters:
- By launch period — find recent Black Friday campaigns or see what your competitors launched in the summer.
- For Google platforms, study the strategies for Search, YouTube, Maps, Shopping, and other services separately.
- In terms of geography, only countries are currently available for selection, but this helps to understand how brands adapt their advertising for different markets.
Practical advice: start your analysis with niche leaders — see what formats they are testing and which platforms they prioritize. If a major player is investing in video advertising on YouTube, there may be an audience there that you haven’t tapped into yet. Don’t overlook seasonality — when your competitors increase the number of campaigns, it may indicate peaks in demand for certain topics.
Betting simulator
This tool can predict the effectiveness of campaigns with different budgets. You can launch the simulator directly from your advertising account — just select the keywords, campaign, or ad group you want. The system will analyze historical data and provide a forecast: how many clicks and conversions you can get at different bids, and what budget you will need.
Forecasts are based on real statistics from thousands of advertisers and analysis of search traffic for your key phrases, so the results are quite accurate — the margin of error is usually no more than 10-15%.
The main feature of the simulator is the ability to experiment with bids and instantly see how this will affect the results. Let’s say you pay 25 hryvnia per click and get 100 clicks per day. The simulator will show that with a bid of 35 hryvnia, the number of clicks will increase to 150, but the cost of conversion will increase by 30%. And if you lower the bid to 15 hryvnia, traffic will drop to 60 clicks, but your budget will be cut in half.
Google Merchant Center
The main value for analyzing competitors in Google AdWords using this tool is hidden in the Merchant Center analytics section — in the “Prices” tab. Here, Google automatically compares the cost of your products with similar offers. The system analyzes two key metrics: the current median price on the market right now and the historical median for the entire observation period.
The second useful report is “Bestsellers.” It reveals the top products in your niche with their market prices. For example, the owner of a sports nutrition store will learn that protein bars of a certain brand are the best sellers at a price of 70-80 hryvnia per piece. If such items are not in the assortment, it’s time to add them.
Important note: for reports to work correctly, you need to fill in the GTIN (global trade item numbers) and brands in the product feed correctly. Without this data, Google will not be able to accurately match products with competitors’ offers.
Third-party tools for analyzing advertising campaigns
Studying competitors’ marketing strategies is a task that has been of interest to PPC specialists for many years. It is not surprising that many services have emerged to automate this process. Below, we will examine the main ones.
Search Engine Marketing
Here, the PPC Toolkit module is responsible for analyzing paid advertising. The main report, Advertising Research, collects all data on paid traffic for any website in a single interface.
The service will show the approximate number of keywords used by another advertiser, their monthly budget, and the volume of PPC traffic. For a detailed analysis, exact copies of the ads and a chronology of their placement over several years are available.
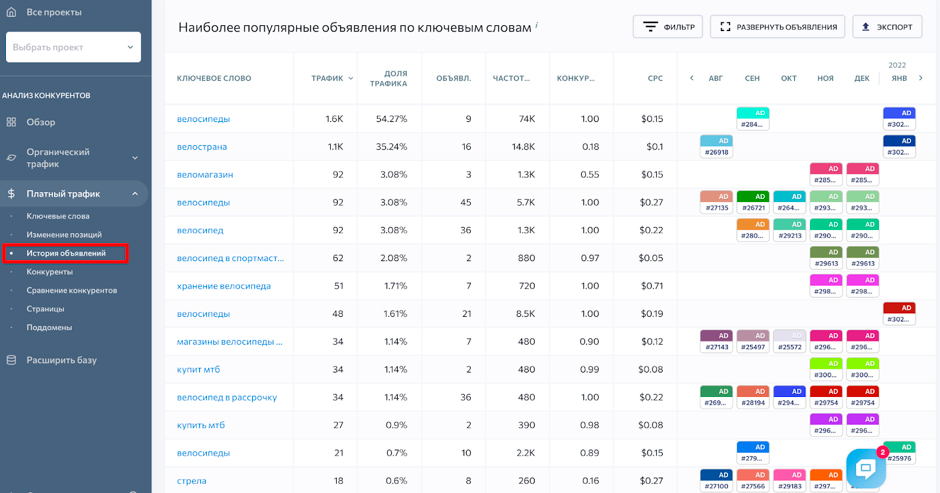
To view the ad history, go to “Domain Analytics — Paid Search Analysis,” enter the desired address, and find the section with historical data.
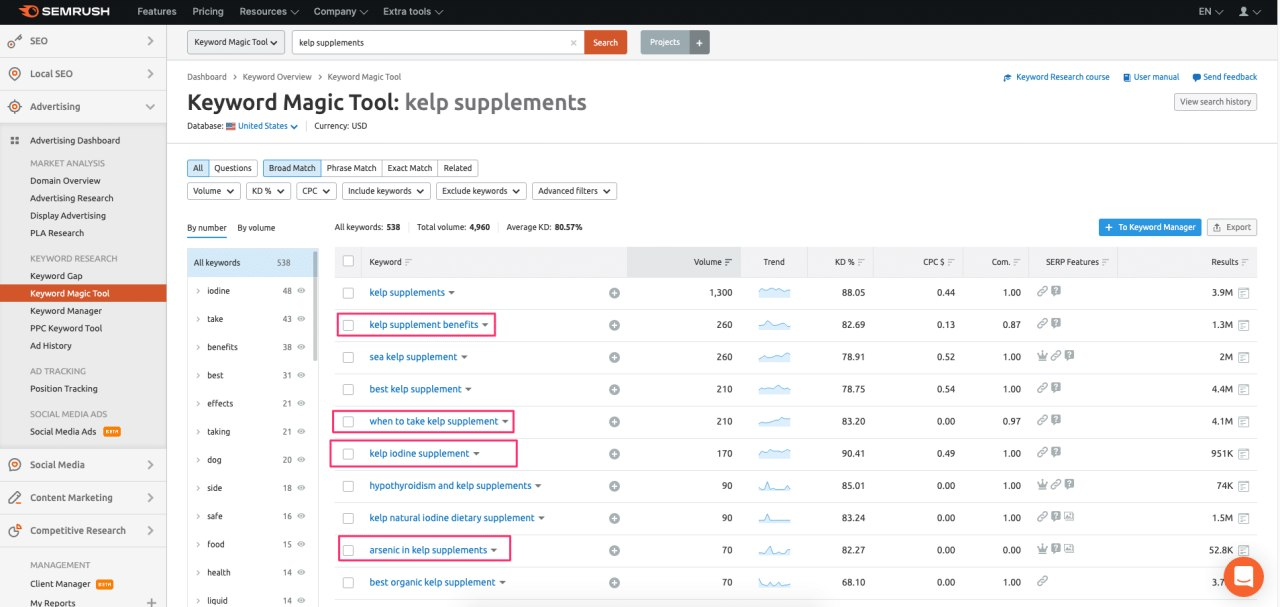
This is useful! In the “Competitors in Paid Search” report, SEMrush shows domains with a similar set of keywords. There you can find players you never even suspected existed — for example, marketplaces or highly specialized stores that are pulling away part of your target audience.
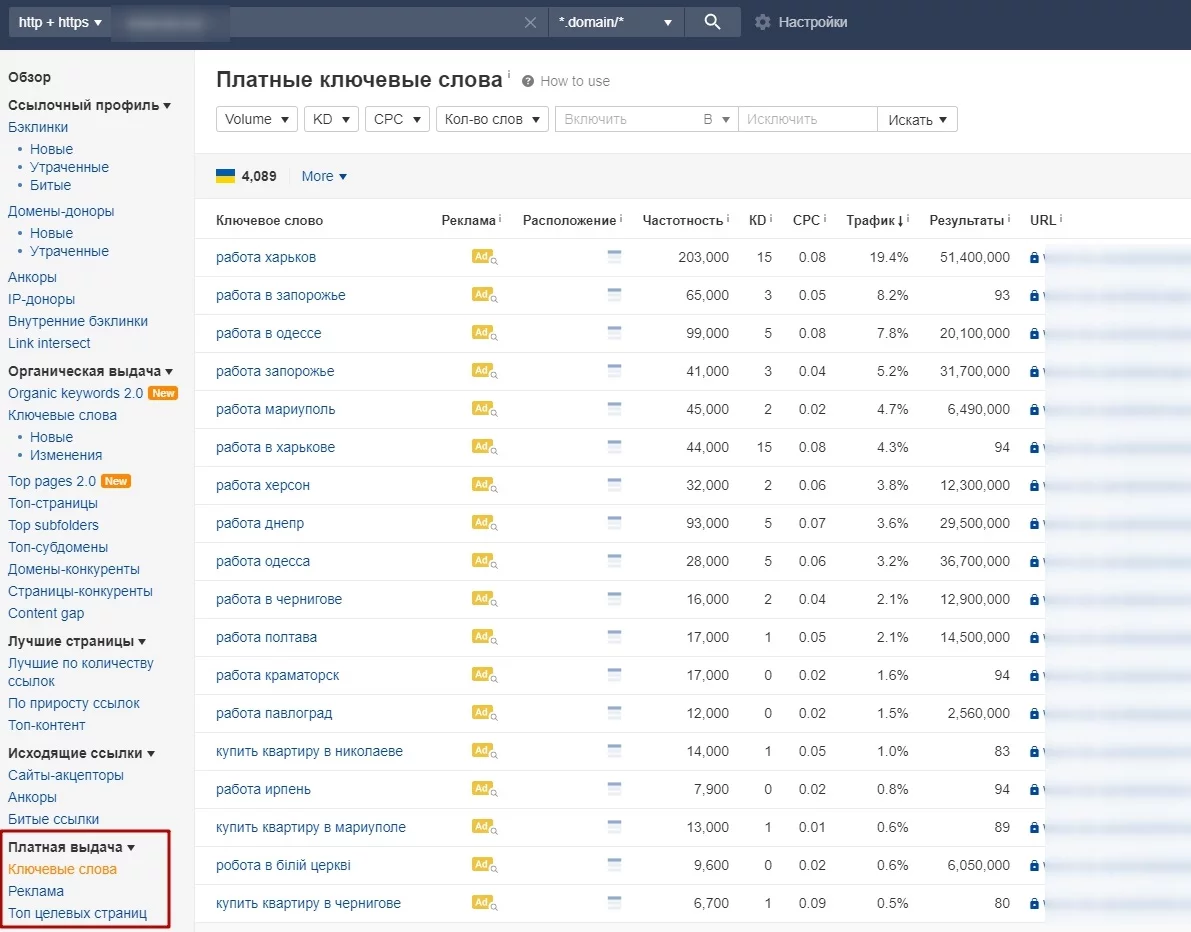
Ahrefs
Although Ahrefs was created primarily for SEO specialists, it is also great for researching advertising campaigns. The main work takes place in the Site Explorer section, which contains all the information about paid promotion: what keywords competitors use, how much they pay per click, how advertising and organic traffic compare, what positions the site occupies in natural search results for the same queries, and where exactly the advertising links lead.
To study your competitors’ ads, go to the “Paid Search” section in Site Explorer. There you will find the full text of the ads with headlines and descriptions:

The section with keywords is especially valuable. For each query, the main metrics are shown here: how often users search for the query, how high the competition is, how much a click costs, and what share paid traffic occupies. With the help of filters, you can quickly find the most profitable key phrases — for example, those with high frequency but low competition.
In the “Top Landing Pages” section, you will see which URLs your competitors are directing advertising traffic to. The tool will show the percentage of PPC traffic for each individual landing page, how many different queries lead to it, and which of them brings the most clicks.
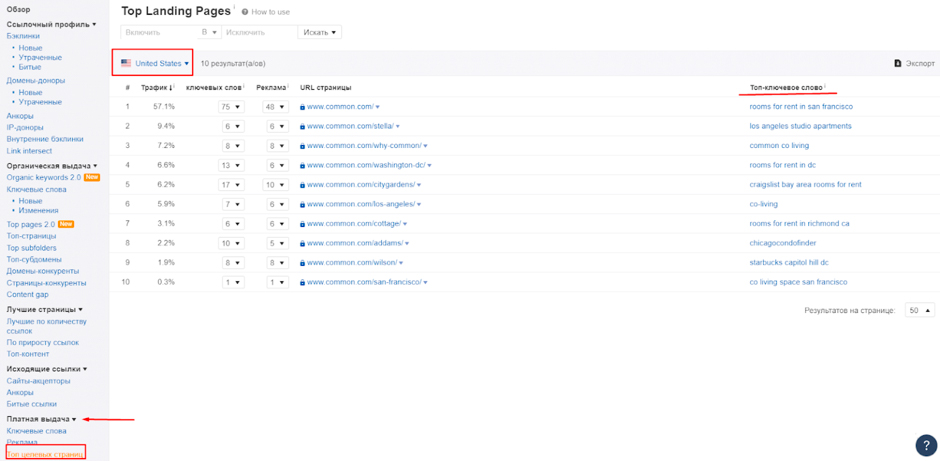
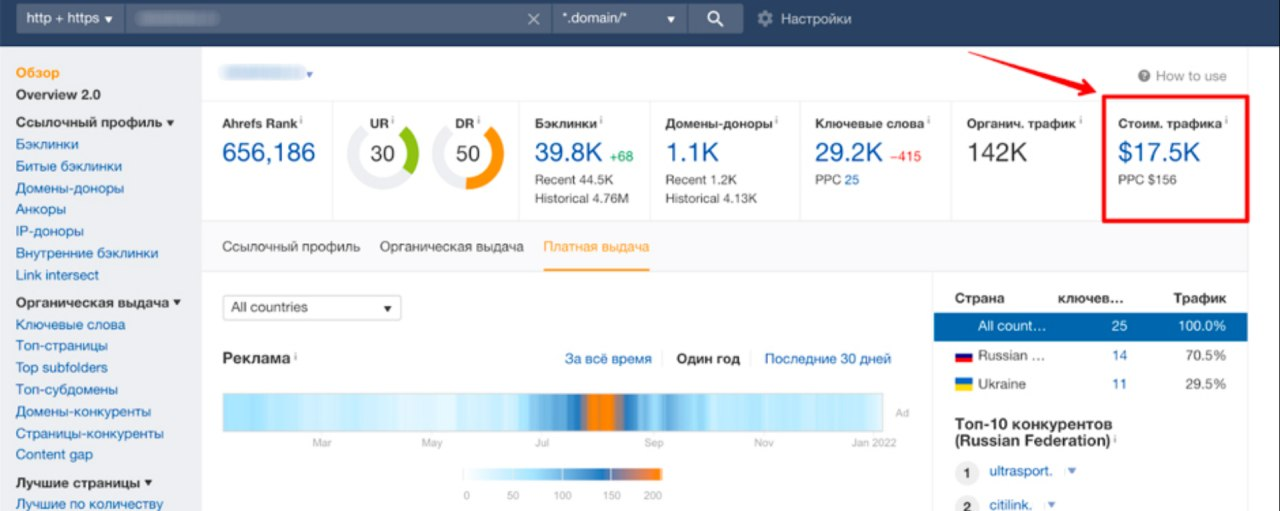
Another useful feature is estimating your competitors’ monthly advertising budget. Even approximate figures give you an idea of the scale of investment and help you plan your own expenses. For example, if the market leader spends $10,000 per month and you are planning a budget of $500, it is worth revising your strategy or focusing on narrower segments.
SE Ranking
To understand how other advertisers get traffic using SE Ranking, enter their website address, specify the desired region and search engine. Then open the “Paid Traffic” section — “Keywords.” There you will find complete statistics on all advertising queries.
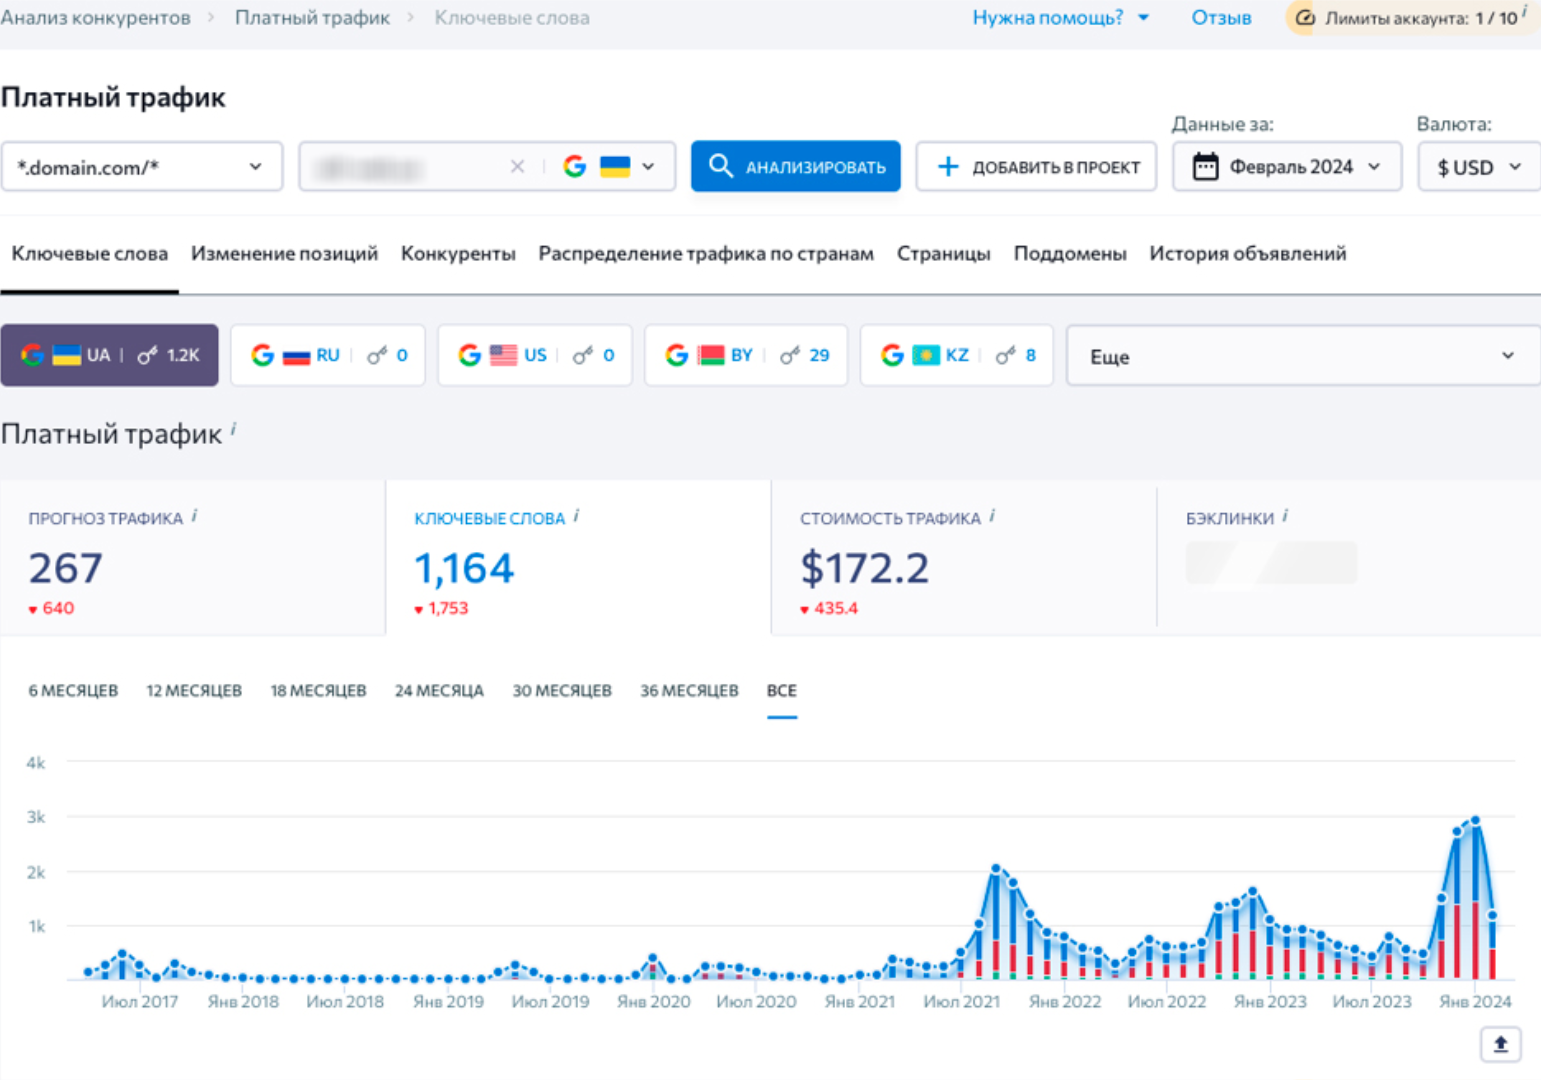
A very useful feature is the search for missed opportunities. In a separate column, the system will show which phrases other advertisers are promoting, but you are not yet. This is a ready-made list for expanding your semantic core. 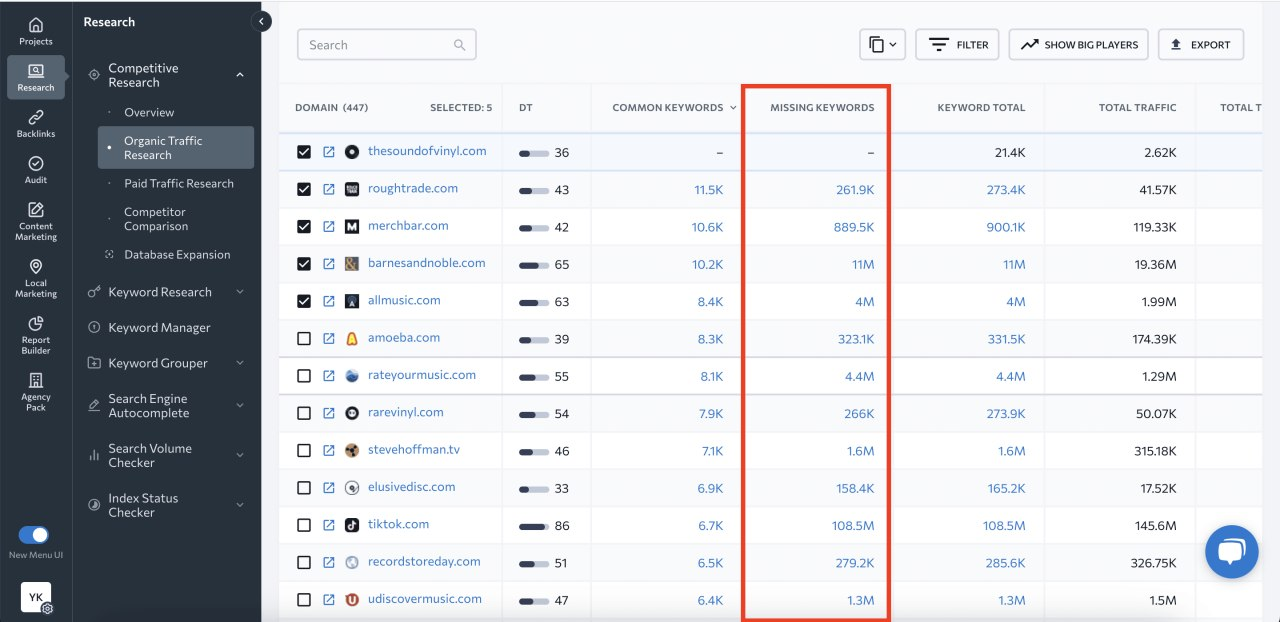
SE Ranking stores the history of advertising campaigns for several years. This allows you to see what ads your competitors ran last year or the year before. This helps you track seasonality and understand what promotions and offers they use at different times of the year.
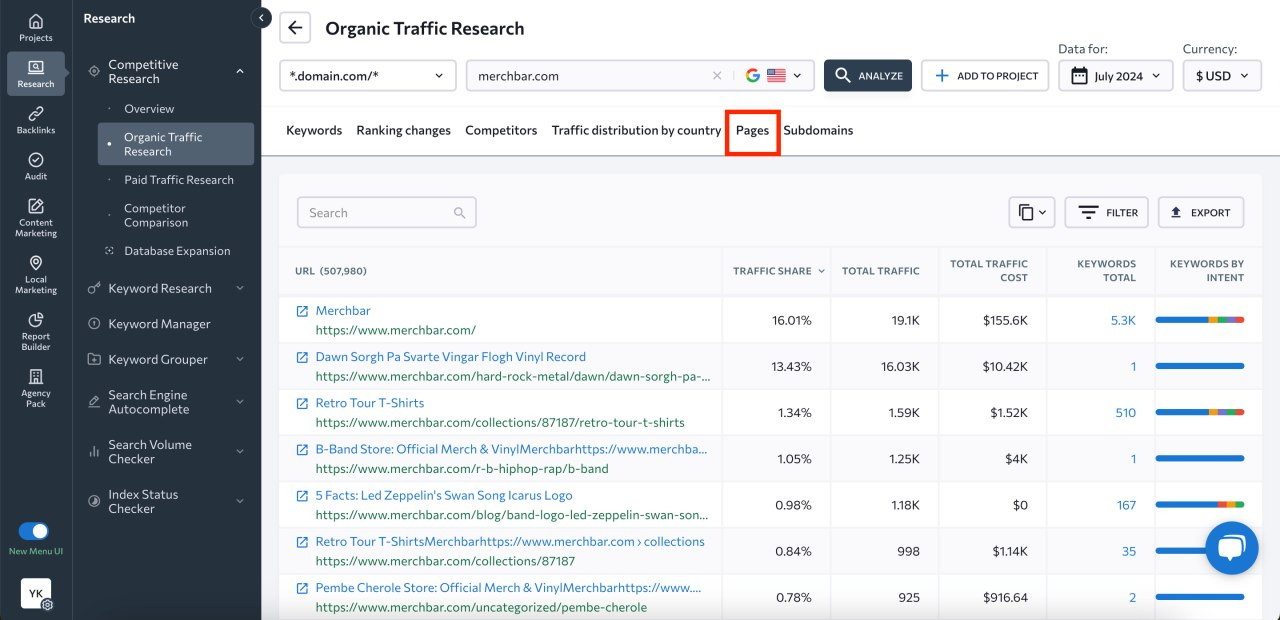
It is also possible to analyze competitors’ landing pages. Landing pages are sorted by effectiveness — those that bring in the most visitors are at the top. For each page, you can see:
- how many people visit it per month;
- how much does this traffic cost;
- how many keywords the ad is targeting.
Clicking on the address will open the page itself — you can study its structure, design, USP, and calls to action.
Marketing expenditure statistics show budget dynamics for specific months. If you see a sharp increase in spending in December, prepare for fierce competition in the pre-New Year season. The table below the graph shows the cost of advertising for each query separately.
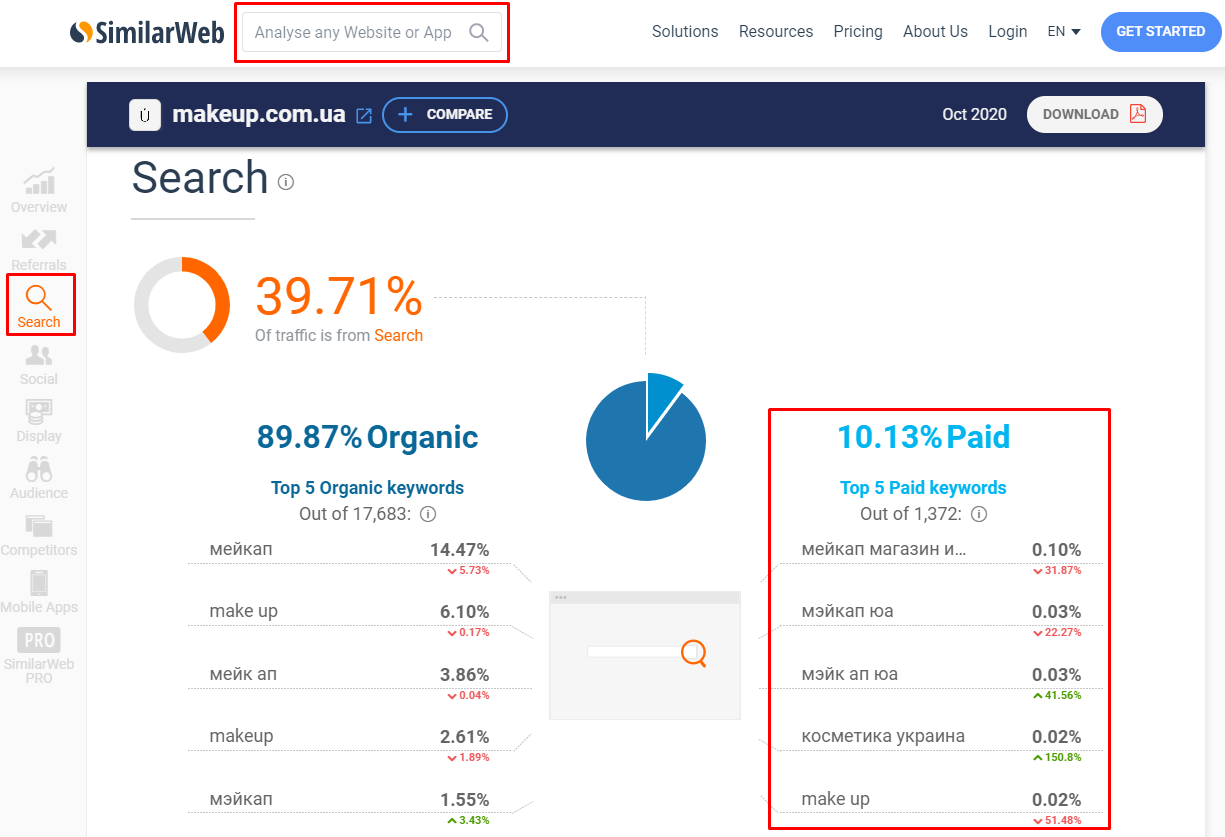
SimilarWeb
The English-language tool SimilarWeb operates on a freemium model. Basic functionality is available to all users. For in-depth analytics and continuous monitoring of market competitors, a paid version is required (starting at $200/month).
However, even the free version of SimilarWeb provides sufficient data. To begin with, enter the domain you are looking for in the search bar. You will see the percentage of paid and organic traffic it receives.
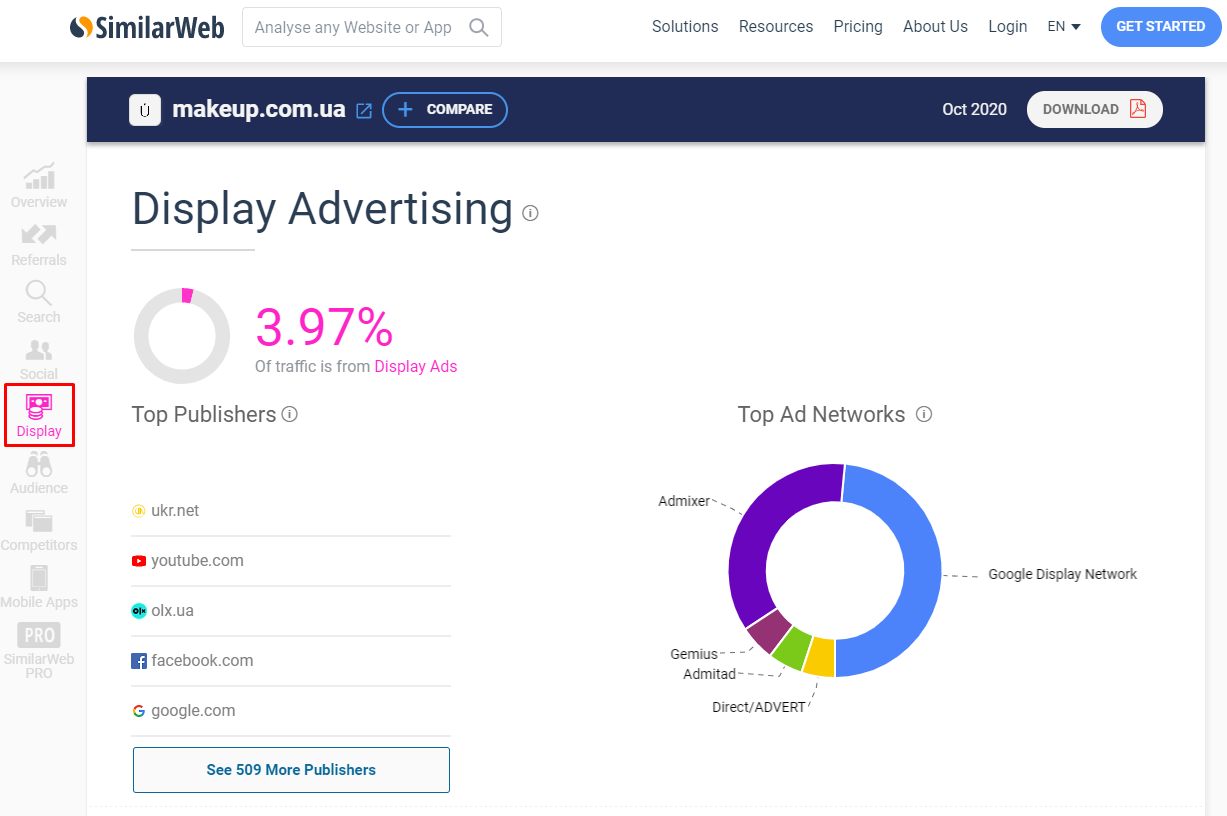
To work with Google Analytics, study the “Display Advertising” report. It shows:
- On which platforms does the competitor display banners?
- Traffic volume from each site;
- Which advertising networks are involved.
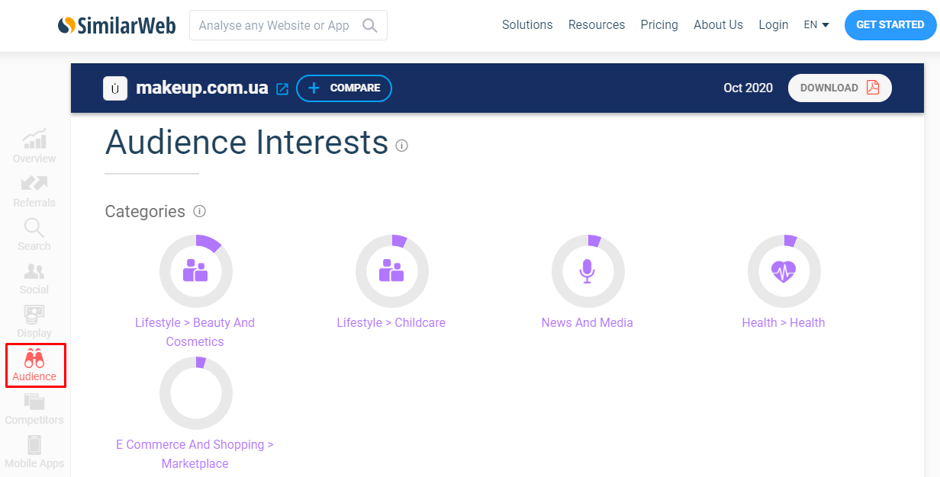
The Audience report reveals other websites that competitors’ customers visit. This is a ready-made list of platforms for use in the contextual media network — the audience there is already warmed up and interested in the subject matter.
Let’s say that analysis shows that visitors to an online sporting goods store also frequently visit websites about healthy eating and fitness blogs. Placing banners on these resources is highly likely to attract the target audience.
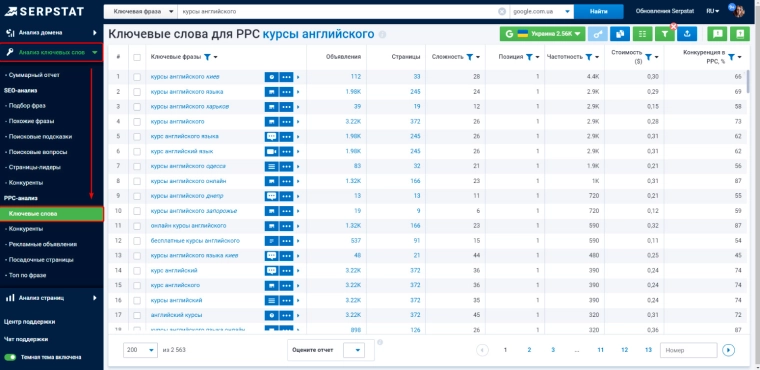
Search engine
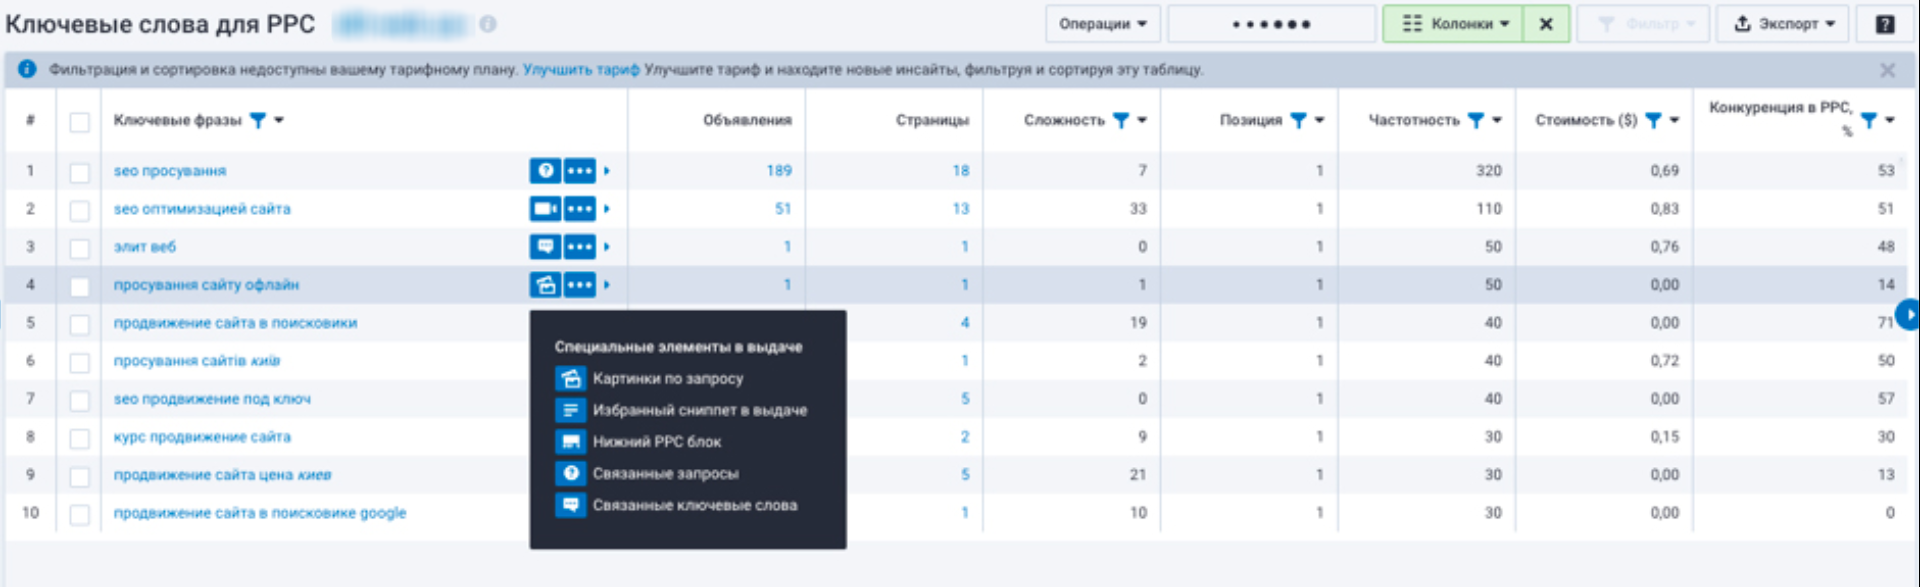
Serpstat provides a comprehensive overview of competitors’ advertising campaigns. To do this, enter the website address in the search bar, select the desired region, and go to “PPC Analysis — Key Phrases”:
Useful life hack. If you have already compiled a list of negative phrases for your campaigns, apply it through a filter before downloading the report. This will allow you to immediately filter out irrelevant queries and get only those that are relevant to your business. For example, for a premium furniture store, you can exclude the words “cheap,” “budget,” and “economy.”
Serpstat shows not only the queries themselves, but also additional search results for each of them. Do you see that a block with a map appears for the query “sushi delivery”? This means that you should connect extensions with the address and work with geotargeting. If quick links are displayed for the phrase, consider setting them up in your ads.
Serpstat also allows you to analyze ad texts:
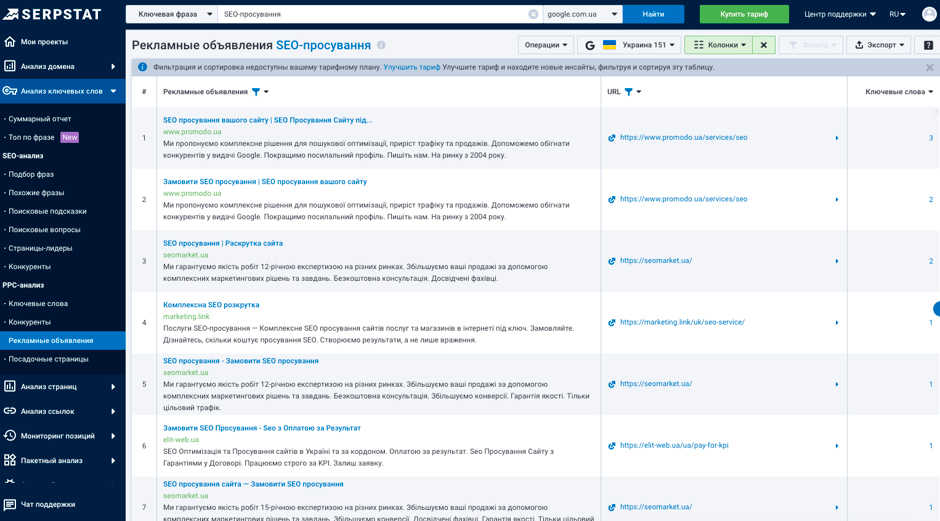
For example, analysis has shown that all successful competitors use specific figures in their headlines (“Repair in 3 hours,” “30% discount,” “5-year warranty”). Take this on board — specifics always work better than general promises.