
Hi! My name is Yana! Today we’ll analyze a product advertising campaign using a real example — an actual advertising account of a sporting goods store. If you haven’t seen my previous materials on optimizing an advertising account during the 2020 crisis — be sure to check them out, links will be in the infobox and in the video hints. There are really many practical things there that will be useful in your work.
The reason for today’s analysis was a specific question from a product advertising specialist. Let me quote the gist: “Launched a search product campaign in mid-August 2019. Set it up according to Google’s standard instructions, everything by default.

Initially, all product items were in one group. In January, I used the automatic grouping suggested by the system. The grouping turned out rather strange, but I left it as is for now — don’t have enough experience to do otherwise. Set different cost-per-click bids for each group.”
Let’s go through the key points and answer them along the way. The main question here is how adequately the product advertising is working now, and whether the bids are set correctly. Essentially, everything implemented in this campaign is based on Google’s standard recommendations.
We’ll see whether it’s worth blindly following these recommendations or if it makes sense to add your own approaches to increase efficiency. And we’ll also separately talk about Smart Shopping — whether it’s worth launching and what pitfalls it brings for the advertising account.
Preliminary Analysis of the Advertising Campaign
First, let’s take data for the last 30 days. Yes, the campaign has been running since August — we’ll review that entire history separately. But why exactly 30 days? We’re currently in a quarantine period, and it’s critically important for us to understand how purchasing behavior has changed in terms of technical metrics of the product advertising campaign. Where do we start?
Analysis of Results by Product Ads
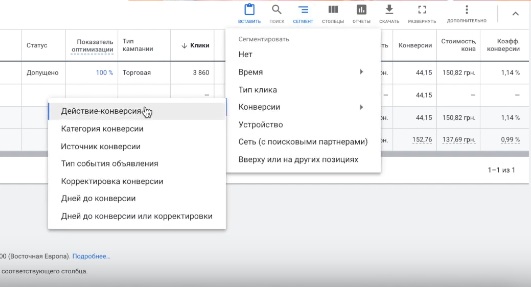
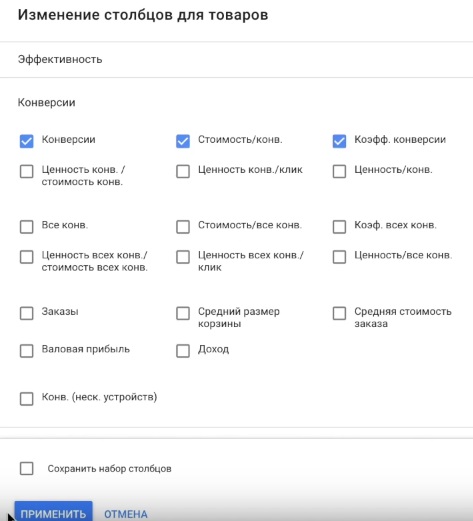
First, we look at what result the product ads brought — of course, in conversions. I’ll additionally do segmentation by conversion type to figure out exactly what actions users were taking. Sometimes micro-conversions are imported into Adwords — and this isn’t a mistake, it all depends on the goals the specialist sets for themselves. But it’s important to clearly understand: does your product advertising campaign mainly generate macro-conversions (target actions like purchases), or does it work more for micro-conversions (page views, add-to-carts, etc.).
In our case, the macro-conversion is “Order placement.” We see 44.15 conversions. The fractional part represents conversions that haven’t fully completed yet. The cost per conversion is 150 UAH. But here’s an important nuance: if you’ve seen my previous analyses, you remember — this account advertises both sneakers, and volleyballs, and soccer equipment, and belts for kimonos.
Each product item has completely different average check and different margin. For example, a conversion for 150 UAH when selling sneakers for 3000 UAH is one story, but when selling a belt for 200 UAH — it’s a completely different story.
So, let’s go into the advertising account. Since from the question description we know the product campaign has been running since August 2019, let’s start with analyzing the quarantine period — this is the most current picture at the moment. Then we’ll look at the dynamics and figure out what was happening throughout the entire campaign operation time.

Conversion Analysis
Only one campaign is running in the advertising account — “Product ad.” The first thing we pay attention to when analyzing any advertising campaign is the result it brings. And the result is conversions.
Additionally, I’ve added segmentation by conversion type. Why? To understand which type of conversions makes up the main share. Sometimes specialists import micro-conversions into Adwords — this isn’t a mistake, it all depends on the goals you set for yourself. In our case, the key macro-conversion is “Order placement.” Important: this is not an e-commerce transaction, but a goal configured to track purchase completion through the cart.
We look at data for the last 30 days — from March 19 to April 17, 2020. During this period, 44 full order placements were received (the fractional part 0.15 is uncompleted conversion achievement). The cost per conversion is 150.82 UAH.
But here’s the thing. If you’ve seen previous analyses, you know: the assortment in this account is very diverse — sneakers of different brands, balls (volleyballs, soccer balls, basketballs), sports equipment, belts for kimonos and much more. Looking at the overall picture, I cannot say whether this conversion cost suits us or not. It’s averaged. The average check for sneakers and the average check for belts for kimonos are completely different numbers. And their margin is different too. Suppose, a conversion for 150 UAH when selling sneakers for 2500 UAH is quite a working story. But when selling an accessory for 300 UAH — it may bring you to zero.
CPA should adjust to the margin of each product group. So that advertising not only pays off but also brings profit. Therefore, one of my basic recommendations for product advertising campaigns — whether it’s regular product ads or Smart Shopping — is to separate priority product groups into individual campaigns. Choose the highest-margin items combined with the most popular ones and highlight them. What does this give in practice?
- Operational management. Turn the campaign on or off with one click — without risk of affecting other products.
- Adequate budgeting. You see that a specific product group is doing well — simply add budget to it. No need to “spread” money across the entire assortment.
- Clear cost per conversion. You always know the real CPA for each group and can quickly react — lower bids, reallocate budget, disable unprofitable items.
Shopping Campaign Settings
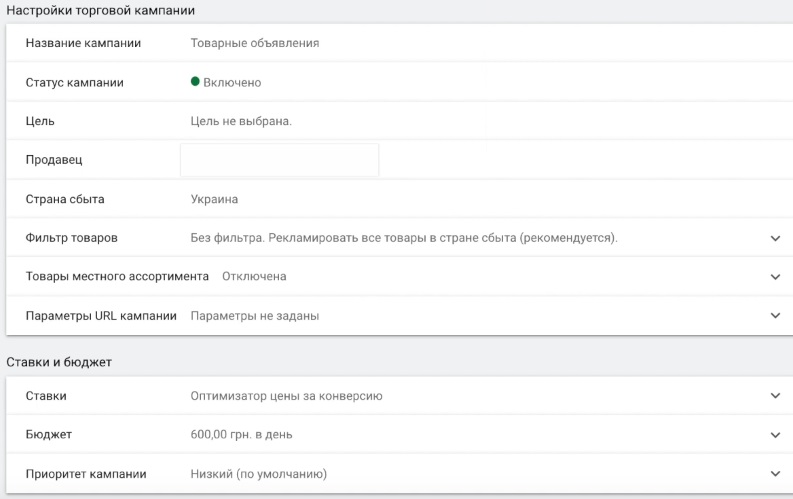
We go inside the advertising campaign and start with settings. What is fundamentally important to pay attention to here? First — the campaign goal. I recommend choosing “Sales.” At previous stages, we’ve already determined that for the “Order placement” goal, the conversion type should be set to “Purchase.”
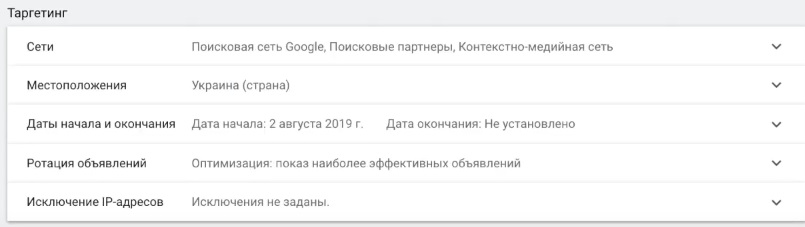
If you haven’t seen the previous analysis on the search campaign — be sure to watch it, there’s a detailed demonstration of how this is set. The point is that the system works much easier when the goal is set correctly — especially in combination with automatic bidding strategies.
Bids and Budgeting
The next important block in settings is the bidding strategy and budget. But first, a few words about campaign priority. If only one shopping advertising campaign is running in the account, you can safely leave the priority low — it has no one to compete with. But when there are several campaigns, priorities need to be set.
How does this work? Priority tells the system which campaign it should promote to display first compared to other product advertising campaigns. At the same time, higher priority usually implies a higher bid. So if you have several shopping campaigns — experiment with different priority combinations.
Now to bids and budgeting. Even when analyzing search campaigns, we found out: a correctly calculated budget is the foundation of effective advertising work. And that means the budget needs to be calculated based on your CPA. For product advertising campaigns, the “Maximize conversions” strategy might work well.
But remember: Google recommends setting a daily budget at the level of CPA multiplied by 10, or better — by 15. And this is another weighty argument why the most popular and margin-rich product groups should be separated into individual campaigns. Then the automatic strategy will get enough data and work effectively.

When you accumulate sufficient conversion volume — at least a hundred per month (though many struggle to get even 20) — you can move to more advanced automatic strategies, such as target return on ad spend. For this, you need to set static or dynamic conversion values. Then the system will be able to optimize the campaign for maximum profitability, not just chase conversions at any cost.
In our analyzed account, there’s a cost-per-click optimizer — essentially manual bid management with a small correction from the system. If the algorithm sees high conversion probability, it may slightly raise your bid. The daily budget is set at 600 UAH.
Let’s calculate. We found that CPA for the last 30 days is approximately 150 UAH. We divide 600 by 150 — we get maximum 4 conversions per day. At the same time, these 4 conversions are distributed randomly across the entire assortment: they may fall on high-margin sneakers for 3000 UAH, or on a belt for kimono for 200 UAH.
All products sit in one campaign after all. As a result, you don’t control which specific items the budget goes to. And this is another serious argument in favor of separating key product groups into different advertising campaigns — this way you’ll know exactly how much you pay for conversion in each category, and can reallocate budget consciously.
Ad Group Breakdown
Moving on. In our campaign — there’s only one ad group. But it could have been done differently. Suppose you’re running a product advertising campaign for sneakers. Nothing prevents you from separating different brands into individual ad groups. Or break down by price ranges: sneakers up to 2000 UAH, from 2000 to 3000 UAH, from 3000 to 5000 UAH, and so on.
You can use other criteria important specifically for your business. The point is that the more transparent the structure — the easier and faster you understand what’s happening in the account, and the more flexibly you manage campaign optimization.
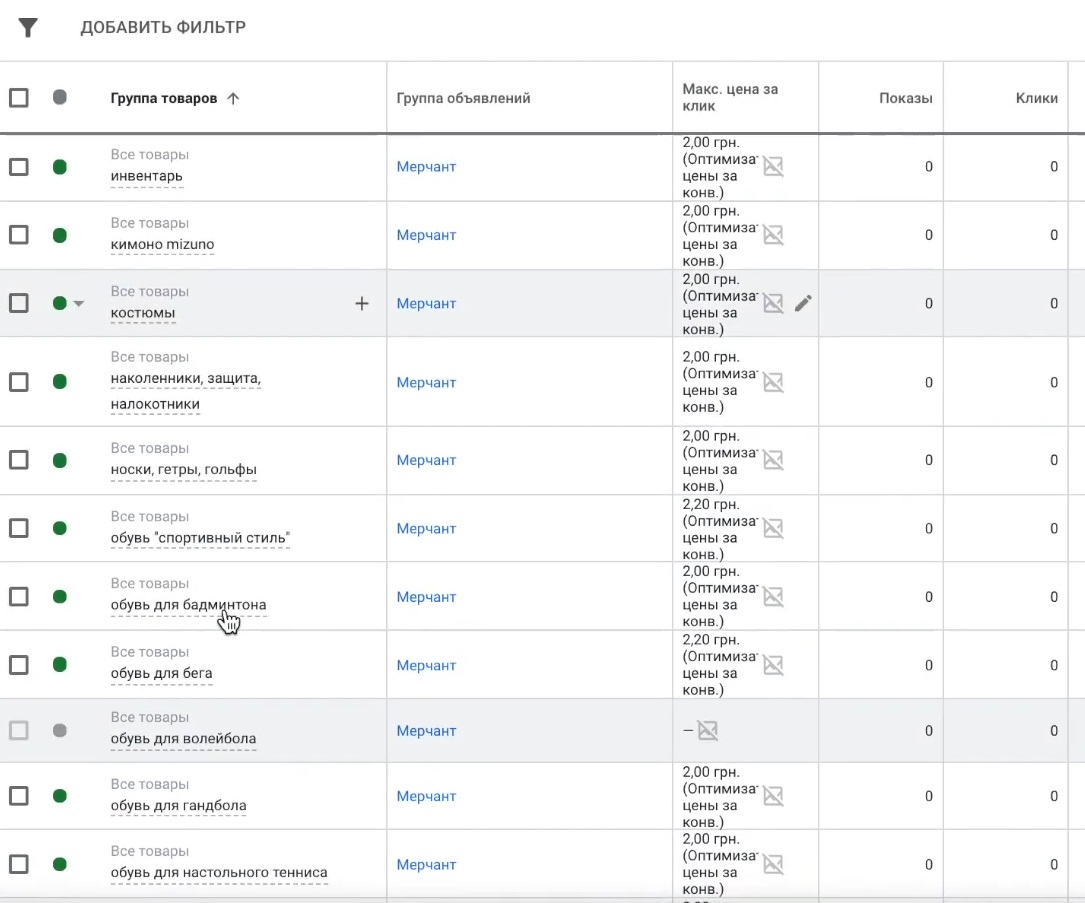
But here we have one ad group. We go into product groups — we see the breakdown: volleyballs, basketballs, other manufacturers, equipment, and so on. This is exactly what the specialist wrote about in their question: the system itself suggested breaking down products by categories. In general — not a bad story. If this is more convenient for you to manage the campaign, why not.
But personally, I prefer when product groups are placed in separate ad groups. Why? Because with the current breakdown, without configured e-commerce transactions, in Google Analytics it’s extremely difficult to understand which specific product group led to conversions.
Yes, theoretically you can build some chain, collect a complex multi-level report and come to a conclusion. But in crisis and quarantine conditions, this is unaffordable luxury. Now you need to monitor campaigns more often, react faster. And if you spend all working days on forming reports — there won’t be time left for the actual adjustments.
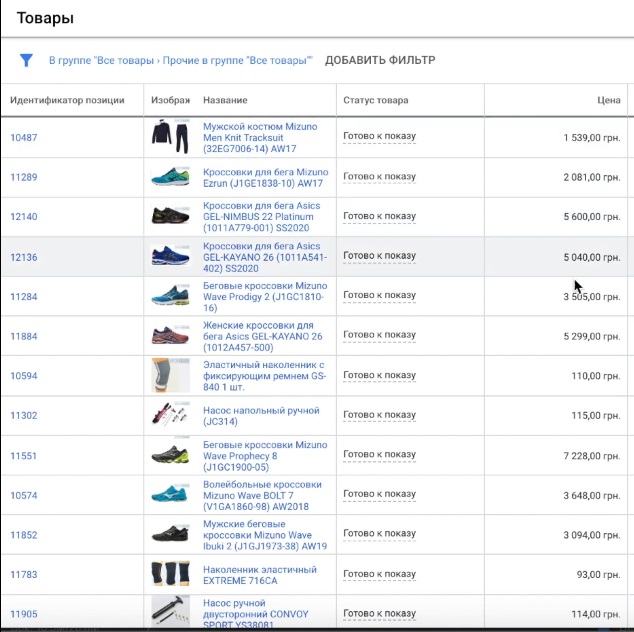
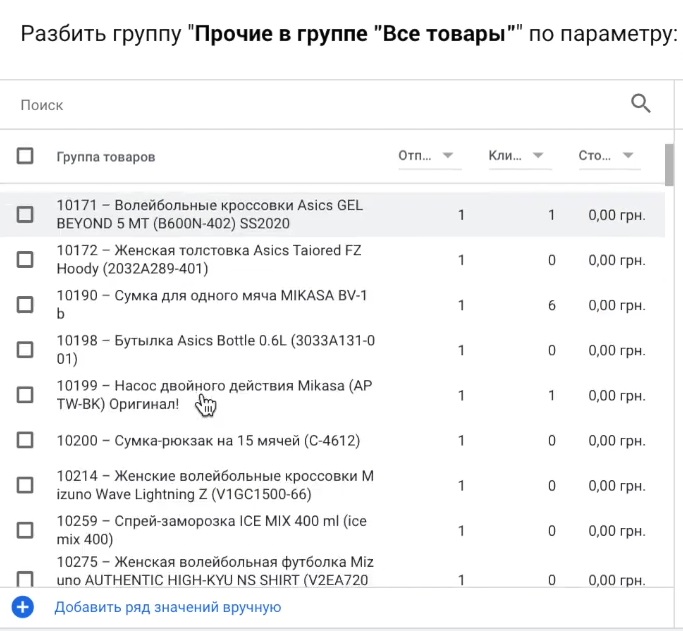
Let’s look further. Here’s the breakdown: kimonos, Mizuno. What do we see for the last 30 days? Many of the highlighted categories simply didn’t get impressions. Mizuno, suits, thermal underwear — zero impressions for the month. But “All other products” — did get them. And into this category fell completely different items: antennas for volleyball net Mikasa, thermal underwear, and a whole bunch of other things — 1052 products.
Do you feel the problem? Such breakdown is extremely inconvenient to manage. Let’s look inside this “Other” group and see how much the average check varies: 110 UAH, 7,200 UAH, 5,600 UAH, 4,731 UAH. The spread is colossal. And the specialist made this breakdown back in January. Now it’s March-April — and the situation essentially hasn’t changed: the “Other products” group that was getting the main volume of impressions, continues to take it.
Let’s add conversion, cost, and conversion rate columns to see the full picture. Here’s the men’s suit Mizuno Men Knit Tracksuit — almost 17 thousand impressions, 278 UAH spent. Does this fit within the maximum CPA? No conversions yet. At the same time, the product cost is 1539 UAH.
Next — running shoes: there’s a sale, 67 UAH spent per conversion, product cost 135 UAH — already better. Other running shoes — 0.63 conversions, another item — 0.87. No full sale. Conversion rates jump drastically from item to item.
Here’s a concrete example of why this matters: “Hand floor pump” costs 115 UAH. Already spent 253 UAH on advertising. Conversion cost up to 90 UAH — but it already exceeds the product cost itself. This item is working at a pure loss. Or elastic knee pad: cost per conversion — 160 UAH, while product cost is only 93 UAH. Also a loss-making story.
Returning to the main point: if you properly separate priority product groups into different advertising campaigns or at least into ad groups with internal grouping, the picture becomes transparent. Sneakers can be additionally broken down by price segments: up to 2000 UAH, from 2000 to 3000 UAH, from 3000 to 5000 UAH, from 5000 to 10000 UAH. Then you’ll immediately see which segment brings profit and which burns budget.
And with the current grouping? Knee pads sit in a pile with a thousand other items. Quickly pausing their display is impossible. If they were in a separate ad group — one click and done: paused, lowered the bid, cleaned up search queries. This simply saves the specialist’s mental fuel.
Summing up on the breakdown. The current grouping suggested by Google didn’t bring tangible results. Two reasons. First, the highlighted categories didn’t get enough impressions. Second, the main mass of products accumulated in the “Other” group, where items with completely different check and margin are mixed together — and the results, accordingly, also turned out “diverse.” Google tried to help, but not in the format that really generates profitable results.
What’s the action plan? High-margin priority product groups are moved to separate advertising campaigns. For example, sneakers — into a separate campaign with grouping by brands: Mizuno sneakers, Asics sneakers, Adidas sneakers. Thermal underwear — separately, with breakdown into men’s and women’s or by price segments. This approach gives full control over budget, bids, and results for each category.

Bid Setting
Next question from the specialist: “I set bids on more expensive items 20 percent higher than on cheap, low-margin items — various small stuff.” Let’s figure out how this affected impressions.
Pay attention: bids were set specifically on product groups, not on ad groups. And what do we see? For the last 30 days on the highlighted groups — zeros. Meanwhile, sneakers, knee pads and other items from the general pile are getting impressions.
Users searched for items from this assortment 315 thousand times — there’s demand. But impressions are going not where we’d like them to. The 20 percent markup in this case didn’t play a noticeable role, because the grouping itself initially didn’t work as needed.
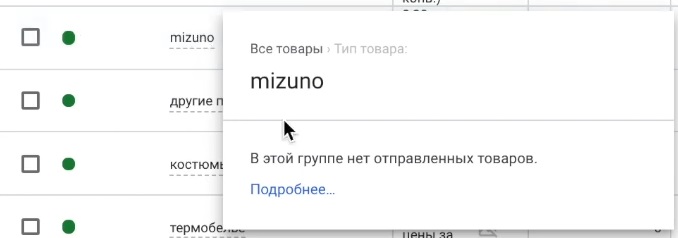
Why didn’t the highlighted groups go into display? Hover over a specific group and see the reason — no products submitted in the group. Thermal underwear — no product items. Suits — same picture. It turns out that the breakdown suggested by Google was incorrect: categories were created, but products didn’t get pulled into them. Raise the bid by 20 or 50 percent — there’s simply nothing to show.
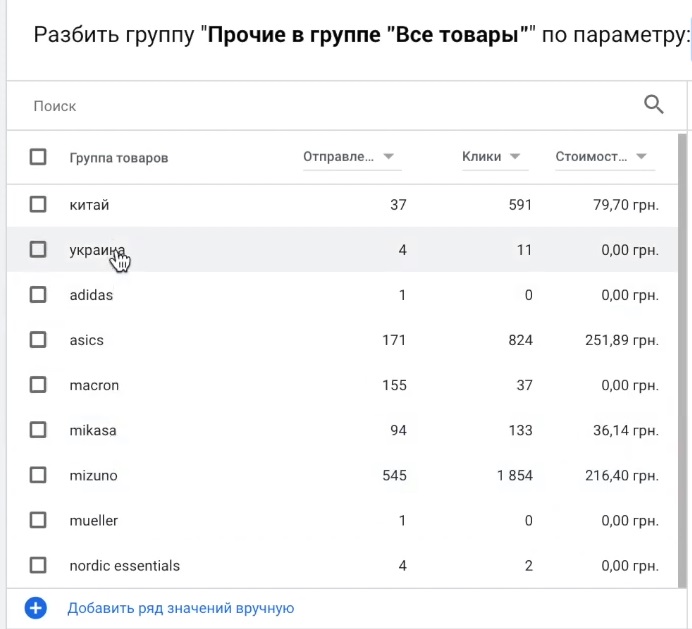
But in the “Other” group, there’s an option for additional breakdown. The system offers options by brands: Nordic, Mueller, Mizuno, Mikasa, Macron, Asics, Adidas, Ukraine, China. You can also break down by identifiers — find all sneakers, highlight them and create a separate group. But this is, let’s say, a makeshift option.
Much more convenient and correct to work with merchant labels (custom labels). These tags can be written at the feed level when forming it on the site. Or you can create them directly in Google Merchant Center using feed transformation rules.
Setting Rules in Google Merchant Center
I’ll show in practice how to create a label for segmenting products by price. Suppose you need to break down the assortment into price ranges — up to 500 UAH, from 500 to 2000 UAH, from 2000 to 5000 UAH, and so on. This is done as follows:
- Go to Google Merchant Center, open the “Products” section and go to “Feeds.”
- Select the needed feed and go to feed transformation rules. There will be a help panel with hints on the right — you can peek.
- Click the plus sign and select “Merchant label” (Custom label).
- As the data source, specify our feed. Then add a rule: select the “Price” attribute and set a range. For example, “is in range from 100 to 500 UAH.”
- Assign a label — name it “from 100 to 500” — and click “Add.”
- If you need to highlight products cheaper than 100 UAH — set the condition “less than 100” and name the label, say, simply “up to 100.”
- Save the rule. Upload to Adwords may take from several minutes to several hours.
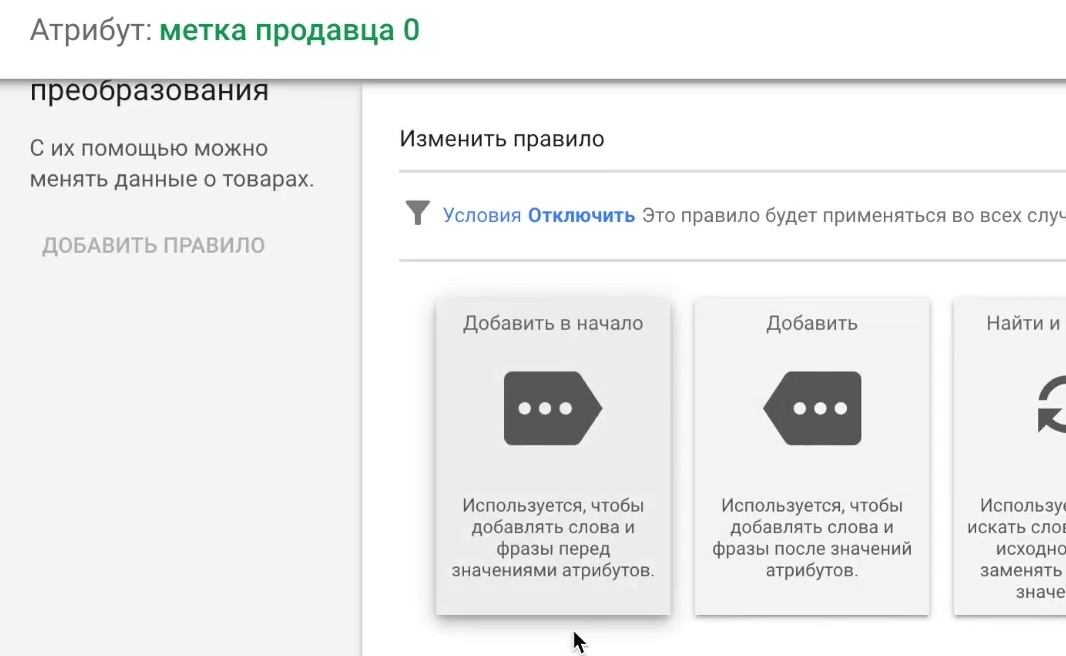
After this, merchant label 0 with the needed name will appear in the advertising account — say, “up to 100” or “from 100 to 500.” And you’ll be able to use these tags to create separate product groups or even separate advertising campaigns for each price segment. This is a simple but very working tool that gives real control over bids and budget for each category.
Merchant Rating
I often hear the question: “Is it true that Google reduces the effectiveness of an advertising campaign if there’s no merchant rating?” No, this is not true. Google does not lower campaign metrics because of the absence of a rating. Merchant rating is simply an additional bonus that may appear in the product ad as stars. It increases user trust and loyalty to the ad, but does not directly affect the campaign rating.
The logic here is simple: the more clickable the ad, the higher its rating. If stars increase clickability — great, the ad gets a small advantage, and you pay slightly less per click. But if there are no stars — you are not penalized. You simply remain at the rating level you earned without them. From my experience, many advertising accounts without merchant rating work more effectively than those that have it. So adding a rating is desirable, but not critical.
But what really hits the effectiveness of an advertising campaign are completely different things. Untimely account replenishment, replenishment for an amount less than the total daily budget of all campaigns — this drastically cuts impressions. Google starts saving, squeezing the budget, and you lose reach. Globally, three factors affect the result: bids, campaign structure, and budgeting. These are what you should focus on, not worry about the absence of stars.
Bids and Google Recommendations
“Bids are set according to Google system recommendations. Is this correct?” Let’s figure it out. The problem is that due to incorrect breakdown and product grouping, it’s impossible to say unequivocally whether a specific product item’s bid is sufficient or not. We look at cost-per-click prices: 1.56 UAH, 1.62 UAH, 1.40 UAH, 2.12 UAH, 1.71 UAH, 1.88 UAH — complete scatter. If the grouping had been built correctly from the start — by brands, price segments or margin — we would clearly understand whether the bid is sufficient for each category.
And Google’s recommendations on bids were applied to those product groups that, as we already found out, remained empty. There are no products in them, no impressions — and evaluating the effectiveness of recommended bids is simply impossible. It turns out to be a vicious circle: the grouping is incorrect, products didn’t get distributed, bids are working in vain.
Additional Feed Fields
Another question from the specialist: “I know that additional fields can be uploaded to the feed — both for display in search results and for grouping. What would you recommend?”
The most universal and flexible tool for grouping product items is merchant labels (custom labels), which we already talked about above. With their help, you can segment products literally by any criterion: by name, by price range, by brand, by product type, by seasonality.
As far as your imagination and Merchant Center functionality allow — that’s how much you can play. Want to mark products as “popular” and “unpopular” — please. Need to separate by colors: red, black, green — also no problem. Want to highlight “clearance” or “new arrivals” — create the corresponding label. Merchant labels give complete freedom in organizing advertising campaigns for your specific business logic.
“Smart Campaigns” Tool
“Is it worth launching smart campaigns in parallel with the main one? And won’t I have to pay twice as much?”
I’ll say it straight: Smart Shopping is one of the most powerful tools Google has created for advertising accounts in the e-commerce sphere. With proper setup, it can generate sales several times, and sometimes dozens of times cheaper than a regular shopping advertising campaign. But — and this is an important “but” — for this, several conditions must be met: transaction value is transmitted correctly, budgeting is set properly, structure is built correctly.
And with structure, the same principle works as with regular product ads. Each Smart Shopping campaign should correspond to a separate product group. Suppose you have sneakers, balls and equipment — so, three separate campaigns. You can, of course, dump everything into one. But then you’ll get the same story with averaged CPA as in a regular shopping campaign: it’s unclear which products bring profit and which burn budget. Granular structure gives noticeably higher efficiency — you see the result for each category and manage budget pointwise.
Now about parallel launch. No, you won’t pay exactly twice as much — but total advertising expenses will grow noticeably. The thing is that Smart Shopping pulls impressions away from the regular product advertising campaign. The system gives priority to the smart campaign, and the regular product ads start “sagging” in reach.
Here you need to decide what’s more important to you. If the result in the form of sales at a favorable price is fundamental — Smart Shopping handles this task excellently. Set it up, make sure everything works correctly — and then simply add budget. The campaign largely works on autopilot.
But if it’s critical for you to understand by which specific search queries ads are shown, and you need the ability to clean traffic — here Smart Shopping has a serious drawback. Viewing the full list of queries and adding negative keywords for irrelevant ones in a smart campaign, unfortunately, is not possible. This is a kind of black box: you set the budget and goals, and the system itself decides who and when to show your products to. For some this is convenience, for others — loss of control. The choice depends on your priorities and business specifics.
How to Reduce Costs for Product Advertising Campaigns?
“What did the transfer to a new platform give? Can costs be reduced without losing traffic? And how to track the result if experimenting with bids every two weeks?”
Transfer to a new platform — this means website transfer. As for reducing costs and experimenting with bids — here everything comes down to structure. If the account had proper grouping built, you could build hypotheses and test them pointwise. But in our case, the grouping is far from ideal, so we need to start with the foundation.
How to generally reduce costs for product advertising campaigns? The principle largely echoes search campaign optimization and consists of two major stages:
- We clean non-target traffic. We cut off all search queries that have no relation to your assortment. In the analyzed account, by the way, there’s already a solid block of negative keywords — this is a good sign, the specialist is working in this direction.
- We filter target traffic. And here the jewelry work begins. You need to go through queries that are formally target but in fact don’t lead to sales. What does this look like in practice?
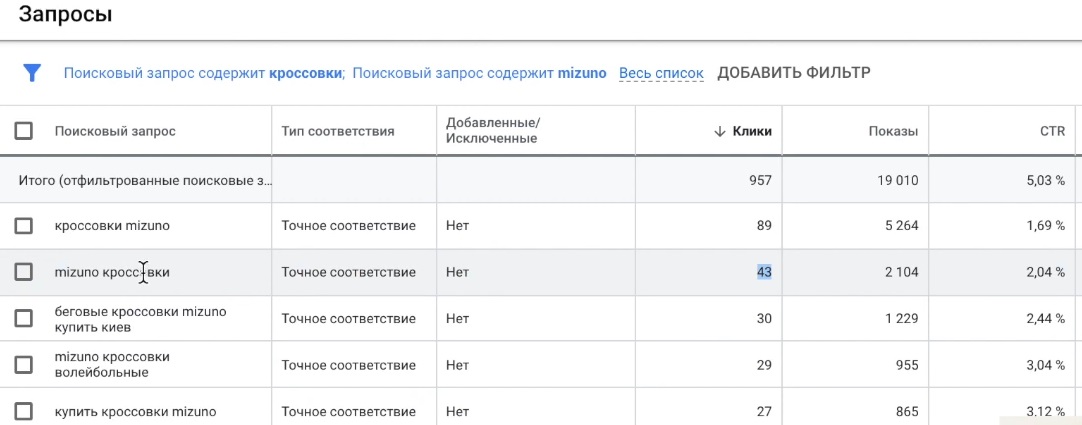
Suppose we take the query “Mizuno sneakers.” We filter all search queries containing this phrase — both in Cyrillic and Latin. We see: 143 clicks, 296 UAH spent, 1 lead received. Then we dig deeper — look at specific models. Perhaps among the queries there are models that are out of stock. They need to be negative-matched immediately — that’s money down the drain.
We take the period from August 2019 and look for patterns: which queries regularly get clicks but don’t convert. For the Mizuno brand without model specification, 89 clicks in Cyrillic plus 43 in Latin accumulated — total 132 clicks. With a site conversion of 1 percent, this should give approximately 1 conversion. If there’s no conversion — we need to figure out why.
Important nuance! The query “Mizuno sneakers” is target. But it’s located quite high in the sales funnel. A person enters it without yet deciding on a specific model, color, size. They’re shown a mixed results: women’s, men’s, red, green, for different sports, in different price ranges. The user clicks, looks, compares — but doesn’t buy. The problem here is not the advertising as such, but the product results: too general a query generates too vague a match.
If the task now is to save money — such general queries are better to disable. If there’s budget reserve for testing — you can leave them, but work on cheapening traffic. How exactly? Look at your product ad through the eyes of a buyer. Compare with competitors in the results.
Sometimes two ads show the same product in the same color — and then the user simply chooses by price. And sometimes a competitor has a pale picture, clumsy description, stuffed with symbols and technical designations. If your ad looks more attractive — you already have an advantage. Quality image, neat description, properly filled feed — all this affects clickability and ultimately the cost of attracting a buyer.
Yes, this process is labor-intensive. There may be 20 thousand queries, 40 thousand. You’ll have to roll up your sleeves and go through each segment in detail. But every penny saved is a penny that you’ll redirect to truly conversion queries.
Test Different Images in Product Ads
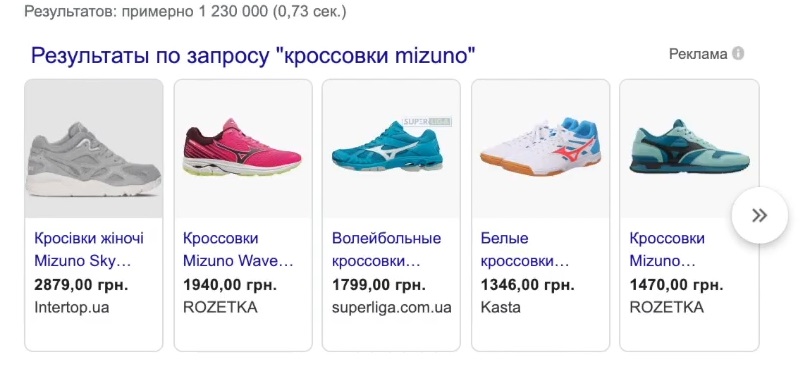
Another important point that few pay attention to — testing images in product ads. Let’s look at the results through the eyes of a buyer. We type “Mizuno sneakers” and what do we see? Almost all advertisers have identical photos — sneakers on a white background, side view. All look like each other, the eye has nothing to catch on. In such a situation, the user simply chooses by price or by rating — because visually distinguishing one ad from another is impossible.
And now imagine: among a dozen identical “sneakers on white background” appears an ad with a photo of sneakers on a foot, in motion, in a sports setting. It immediately stands out. It will be clicked with higher probability — even if a competitor has a merchant rating with stars.
If you talk to guys who sell shoes through Instagram, they’ll say straight: standard catalog photo on a white background is the worst creative option you can come up with. Even a simple phone photo — how feet look in these sneakers on the street or in the gym — will work better. Why? Because the buyer needs to see the product in life, imagine it on themselves. Sneakers in motion sell. Sneakers on a white background — just stand in a row with a dozen similar ones.
This is a simple life hack that really increases CTR of product ads. But almost no one wants to bother with this. No one makes alternative photos, no one tests them. And yet this is what working with product advertising is about — set up the campaign once and forget won’t work. You have to think, experiment, find what will make you stand out among competitors.
Returning to our example with Mizuno sneakers. We figured out why this query may be non-conversional: it’s too general, located high in the funnel, and the cost per click is quite high. With the current grouping and campaign structure, you need to sequentially clean target traffic: find similar general queries, filter them, add negative keywords. This is one of the working ways to cheapen traffic in product ads.
Use Automatic Strategies
The second way to reduce costs is to connect automatic bidding strategies. However paradoxical it may sound, but for automation in a product advertising campaign to work truly effectively, you first need to set up transmission of transaction data and their value to Google Adwords.
And here’s an underwater stone that many forget about. Sometimes it happens like this: e-commerce transactions in Google Analytics are set up, all data — order amount, cart composition, number of items — is transmitted to analytics correctly.
But this information doesn’t come to Adwords. Because for transmitting value specifically to the advertising account, separate tags are needed that push data directly to Adwords. These are different mechanisms, and one doesn’t replace the other. When setting up e-commerce, be sure to clarify this point with the developer or analytics specialist — whether transaction value is transmitted not only to Analytics, but also to Adwords. Without this, automatic strategies like target ROAS simply won’t be able to work correctly.
What Additional Toolset Should Be Used?
By and large, we’ve already covered the main points above. Let’s put everything together into a single picture — what specifically needs to be done:
- Set up import of transaction values into Google Adwords so the system understands how much money each sale brings, and can optimize campaigns for profit, not just for number of conversions.
- Test Smart Shopping. With proper setup, it’s capable of bringing sales significantly cheaper than regular product ads.
- Separate priority product groups into individual advertising campaigns with proper internal grouping.
And with priority groups, let’s figure out in more detail — what exactly is meant by this. This is not simply “the most expensive” or “the most popular” products. These are items where two criteria combine simultaneously: there’s stable demand for them and they have sufficient margin.
High margin here doesn’t mean “the highest in the assortment.” It means that the product has financial cushion to survive inflated CPA in the early stages. Lowering the cost per conversion over time is easier than waiting for months for any sale of a non-moving item.
But if you add to the priority group items that have practically no demand — you’ll wait endlessly for results. These two factors should work in combination. And another thing: if you see that some product group is steadily getting clicks, spending budget, but not bringing sales — disable without regrets. Now is not the time for experiments for the sake of experiments. The task is to get sales for items that people actually buy.
Is there some magical tool besides Google Shopping that will solve all tasks at once? No. We work in a highly competitive environment, and in the quarantine period competition has only intensified. Moreover, competitors are not only direct rivals with similar assortment. Suppose you sell Mizuno sneakers through an online store.
Your competitor is not only another sporting goods store. It’s also marketplace-displacers, channel competitors like Instagram sellers, substitute products from adjacent categories. All of them fight for your target audience’s attention and complicate the path to sale. Therefore, working on optimizing a product advertising campaign is not a one-time action, but a constant process: test, analyze, cut off the excess and scale what brings results.
Working on Increasing CTR
The essence of working with a product advertising campaign is maximally detailed grouping of product items and constant tracking of their effectiveness at least at the Google Adwords level. Suppose you look at statistics and see: traffic is quality, it converts, cost per conversion fits within acceptable limits. But you want more. You want to increase the flow of visitors to the site. And here CTR comes to the fore — the clickability indicator of your ads.
There’s an opinion that CTR in Google Shopping isn’t that important. Perhaps partly this is true. But I wouldn’t be so categorical. Look: if a certain search query and a certain product group steadily generate conversions at a good, acceptable price — and you want to increase their volume — you can’t do without working on clickability. The higher the CTR, the more target traffic gets to the site with the same number of impressions. And therefore, potentially — more sales.
How to work on increasing CTR in product ads? There are several tools:
- Test different titles and descriptions of product items. Sometimes replacing a couple of words in the headline drastically changes clickability.
- Experiment with images — we talked about this in detail above.
- Use additional features: reviews, merchant rating, sale blocks, delivery information. Functionality depends on the country — not everything is available for Ukraine, but everything that can be connected is worth connecting.
From this list, two basic elements that right now, even without merchant rating, can affect CTR — are image and text.
With text, everything is relatively simple. You can change it directly in Google Merchant Center through feed transformation rules. No need to involve a programmer, no need to rewrite the product name on the site. Went into rules, adjusted the title or description — and done.
With images, you’ll have to bother a bit more. Here, without a programmer or designer, it may be difficult — you need to prepare alternative images, upload them to the feed, test. But the result is worth it. I’ll give an example from practice: I analyzed a product advertising campaign for clothing — jeans for pregnant women.
The assortment had sizes 46, 50 and larger. In the photo — a slender girl with a neat little belly. And now imagine a buyer of size 50+. She sees a model on whom these jeans clearly won’t fit, and walks past. And a competitor shows the same jeans, but on a model of corresponding build. Who will get the click? Obviously — the one who gives the buyer the opportunity to imagine the product on themselves.
This principle works for any category. Sneakers — show them on a foot, in motion. Sports equipment — show it on an athlete. A ball — show it in play. The more realistic and closer to life your creative is, the higher the probability of a click. And how exactly to get fancy with images — depends on your imagination and possibilities.
The main thing — don’t be afraid to test. Most advertisers use standard catalog photos and don’t try to change anything. This is your competitive advantage — while they stand still, you experiment and take clicks for yourself.
This concludes the analysis of the product shopping advertising campaign for the sporting goods store. I hope this material was useful, and you’ll be able to apply these recommendations in practice!