An ADW Service study across 201 ad accounts, ~15 months, nearly 10,000 target ROAS changes
In short
Target ROAS (tROAS) in Performance Max is treated as a “profitability dial”: raise the target to lift profitability, lower it and you lose. We tested this on a dataset of nearly 10,000 real tROAS changes across 201 accounts over 15 months. The conclusion is different:
tROAS is a lever for volume and cost-per-click, not for profitability. Actual ROAS barely follows the target. What determines the outcome is not the size of the change, but the campaign’s starting position and its channel. And one more thing: Performance Max and Shopping react to the same action in opposite directions.
Below is what we found, with the data.
Important note on the period. All measurements in this study reflect how Google Ads operated as of before August 17, 2026. On 17.08.2026 a platform update takes effect that, for budget-limited campaigns, changes the relationship between target and actual ROAS. The bidding mechanics (how tROAS affects cost per click, volume, and the profitability ↔ volume trade-off) remain valid. We deliberately publish this “pre-17.08” picture as a fixed baseline — and will separately continue the analysis after the update takes effect (see the final section).
Key findings (concise, with numbers)
Per the ADW Service study (201 accounts, ~9,900 tROAS changes, 2025–2026):
- Lowering tROAS in Performance Max increases conversion volume by ~11% and cost per click by ~6%, while actual ROAS changes only ~−3%.
- Raising tROAS reduces volume by ~6% and lifts actual ROAS by only ~5%.
- The size of the tROAS change does not predict its effect on profitability — the outcome is determined by the starting position (actual ROAS relative to target), not the size of the step.
- Performance Max and Shopping react in opposite directions: lowering tROAS increases volume in PMax (+11%) and decreases it in Shopping (−17%).
- The system under-delivers: actual ROAS rises by roughly one-third of how much you raised the target (transmission coefficient ≈ ⅓).
- Overshooting the target raises actual ROAS but at the cost of volume (down to −15%) and spend (down to −27%) — a trade-off, not a free gain.
- Raising the budget scales volume (+36…+52%) but lowers ROAS by −6…−8%, and only works when the campaign is capped by its budget.
- When volume drops after lowering tROAS, in 85% of cases the cause is not the bid: ~50% seasonality, ~13% budget cuts, ~22% other factors, only ~15% the pure rate effect.
Why we measured this
Two years ago the industry produced the first serious attempts to describe how tROAS affects results (notably the smec publication). Since then Google’s algorithms have changed substantially — Performance Max became the dominant format, and bidding behavior shifted. We did not set out to refute earlier work. We set out to update the picture: how this works today, on fresh data, from our own agency practice.
How we measured (brief methodology)
- Source: target ROAS change history (exported from the Google Ads interface, MCC level) plus weekly campaign-level facts (conversions, conversion value, cost, clicks, impressions).
- Scale: 201 accounts, ~4,000 campaigns, ~9,900 unique tROAS changes, ~40,000 budget changes.
- Comparison windows: “before” = 28 days prior to the change; the learning period (0…+14 days) was excluded; “after” = day +15 through +42.
- Reliability threshold: at least 30 conversions in each window.
- Seasonality: normalized per account, so we don’t attribute demand swings to the change.
All figures below are medians (more robust to outliers than means). Where the sample is small, we flag it.
Finding 1. tROAS moves volume and CPC, not profitability
Grouped by direction, the picture is clear:
- Lowering tROAS: volume +11%, cost per click +6%, actual ROAS −3%.
- Raising tROAS: volume −6%, cost per click +2%, actual ROAS +5%.
Profitability shifts weakly in both directions, while volume and cost per click move materially. tROAS behaves as a regulator of how much traffic and at what price the system is willing to buy — not of how profitably.
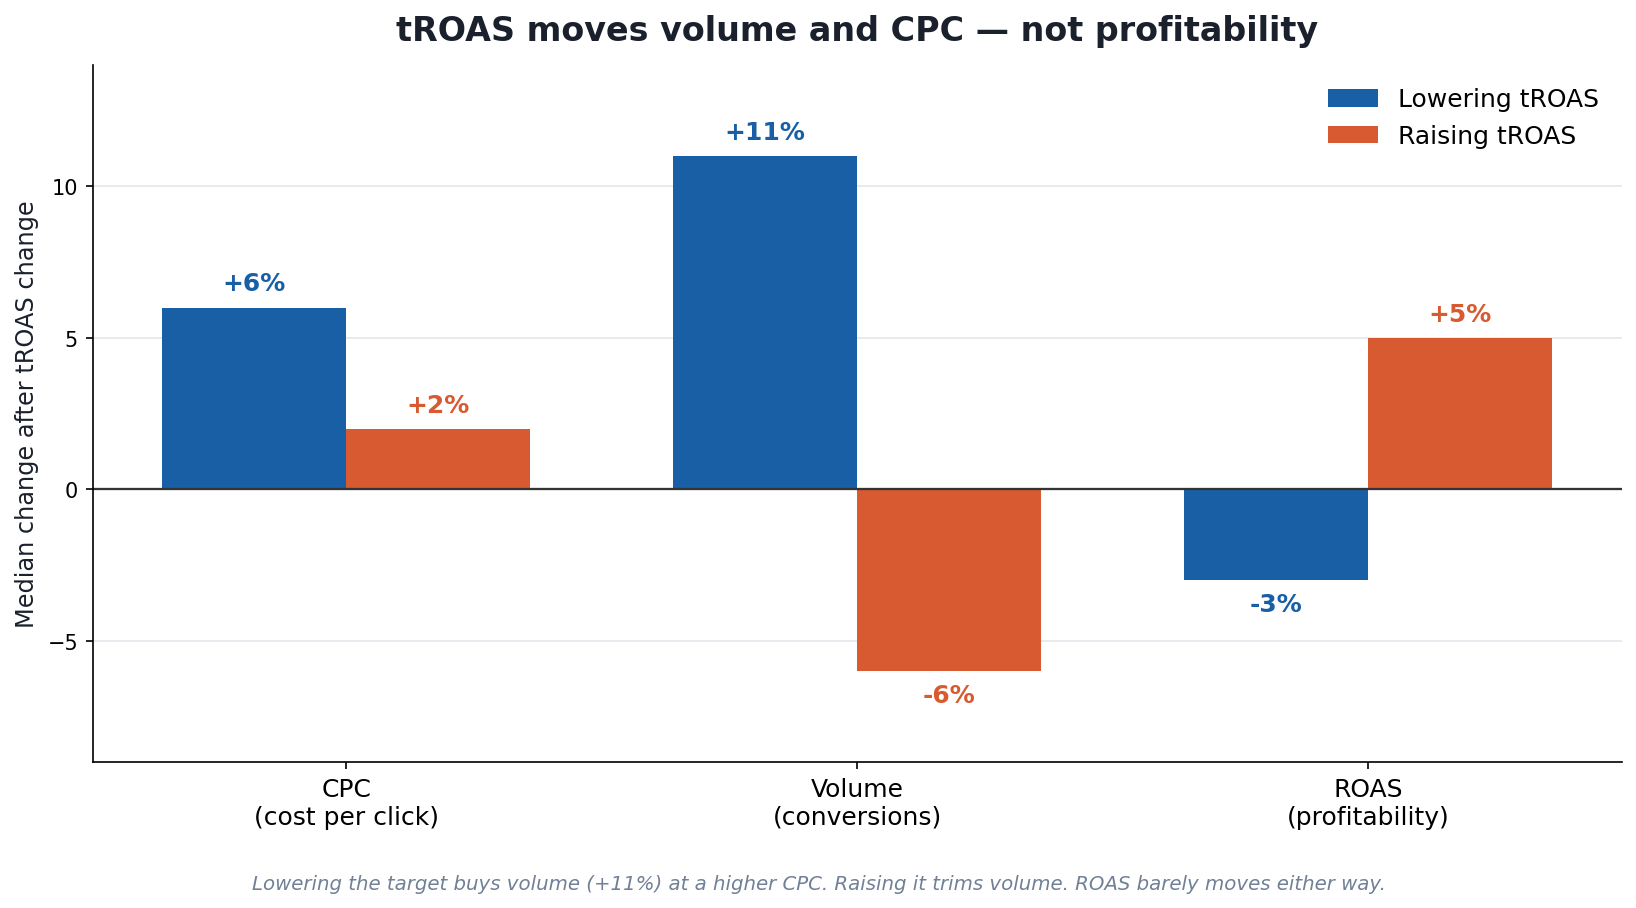
Lowering vs raising tROAS
Finding 2. The starting position decides, not the size of the change
Intuition says the harder you turn the target, the bigger the effect. The data says no.
Grouped by step size (−5%, −10%, −20%, −30%), the impact on ROAS is flat — the step does not predict the result. What does predict it is the starting position: where actual ROAS stood relative to the target before the change (we call this the feasibility ratio = actual / target).
- Actual below target → the target is too high, the campaign can’t reach it → lowering helps (releases volume).
- Actual at target → the system is balanced → leave it alone.
- Actual above target → there’s a profitability surplus → it can be traded for volume.
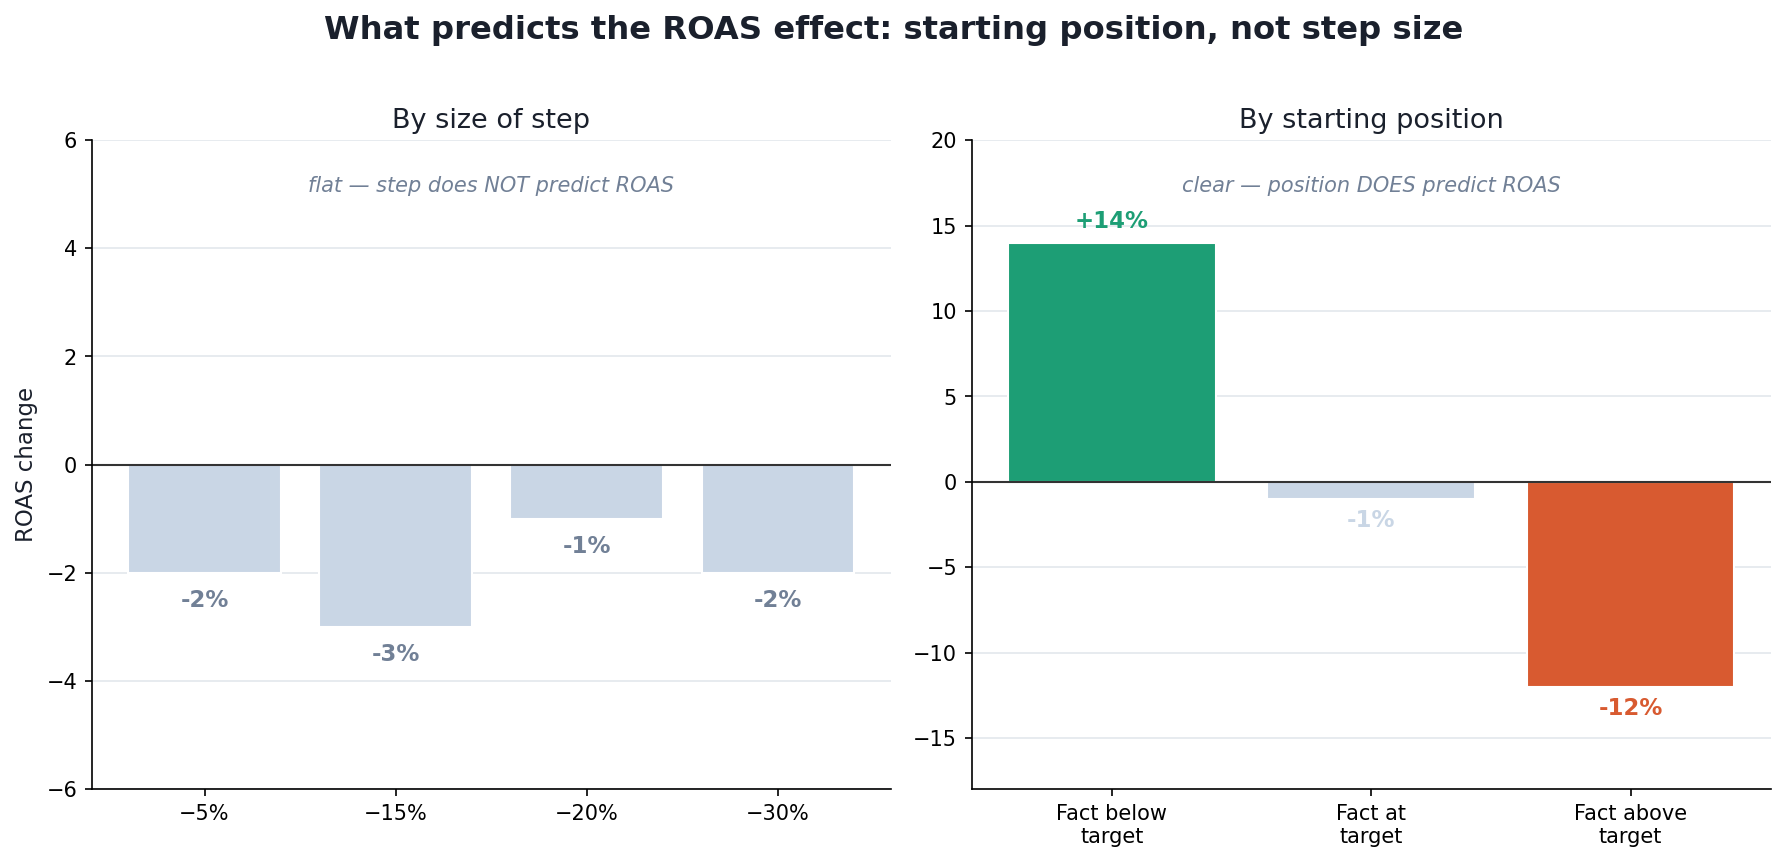
Step vs starting position
This is the core practical takeaway: the question is not “how much to turn,” but “from where.”
Finding 3. Lowering tROAS raises cost per click — mechanically, not by chance
Cost per click rises consistently across all reliable steps: −5% → CPC +8.5%, −15% → +6.5%, −20% → +5.1%.
This follows directly from how bidding works: max CPC = (average order value × conversion rate) / target ROAS. Loosen the target and the system is allowed to pay more per click, so it enters more expensive auctions. That’s why volume and CPC rise together.
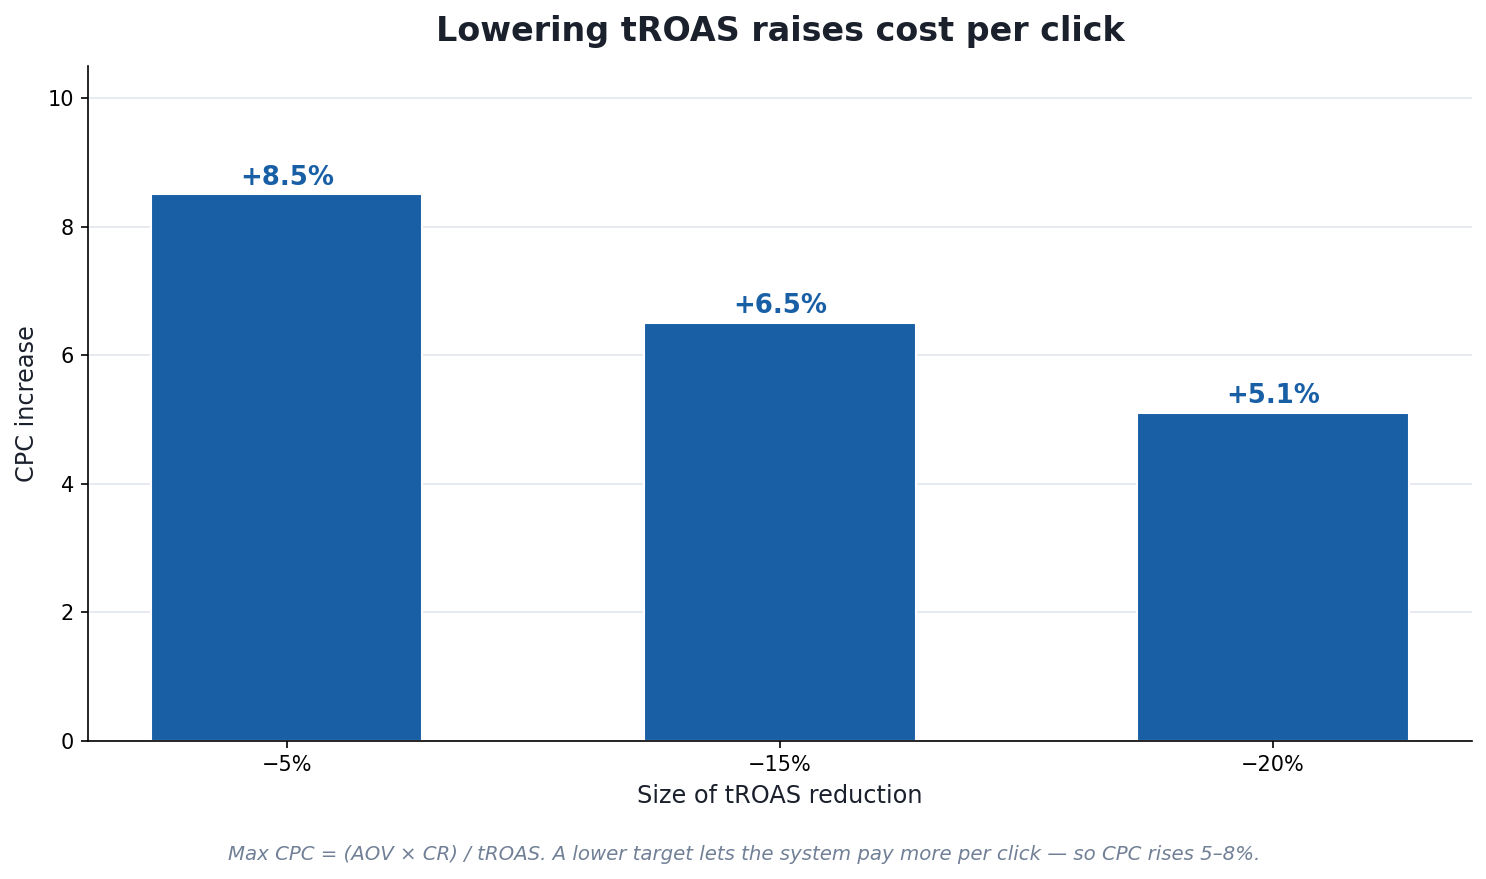
Lowering tROAS raises CPC
Finding 4. A large tROAS drop is a lottery, not a lever
The temptation to “slash the target and rev up the campaign” is dangerous. For large drops (≤ −30%) the result is unpredictable: roughly 50/50 whether ROAS improves or worsens, with an enormous spread across individual campaigns.
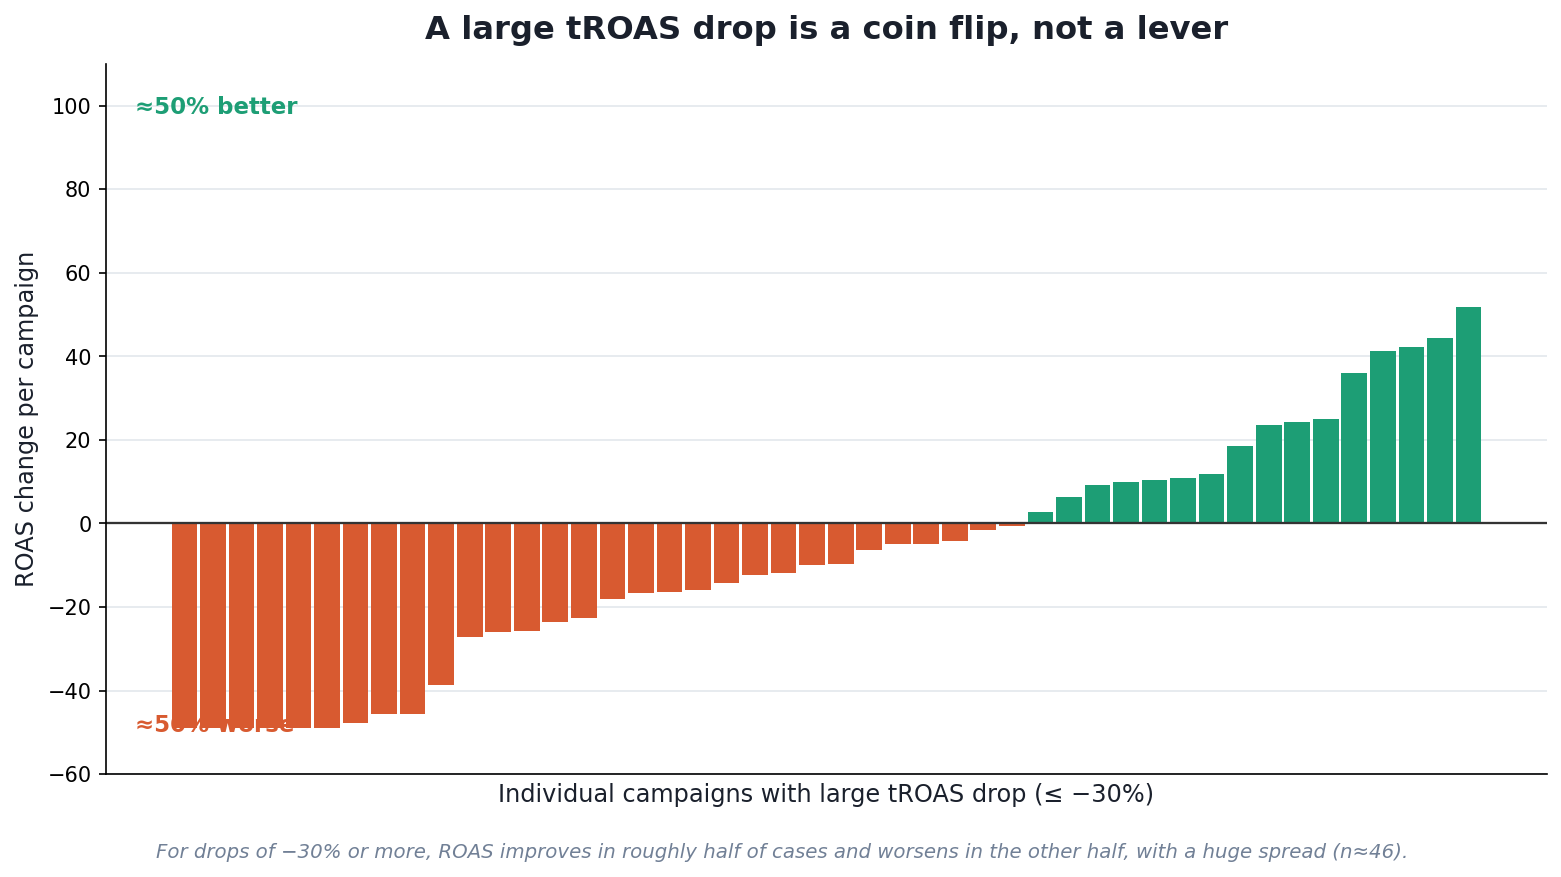
A large drop is a coin flip
So large drops are not a controllable lever but a gamble. If you must cut deep, do it in steps, watching CPC after each one.
Finding 5. When volume falls after lowering, the bid is rarely the culprit
A common error: volume dropped after lowering tROAS, therefore the change is to blame. We decomposed every volume-drop case into causes:
- 50% — an external demand drop (seasonality), would have happened anyway;
- ~13% — budget was cut at the same time (confirmed via budget-change events);
- ~22% — other, not explained by the bid (likely asset groups / feed / competition);
- only ~15% — genuinely the pure effect of the bid reduction.
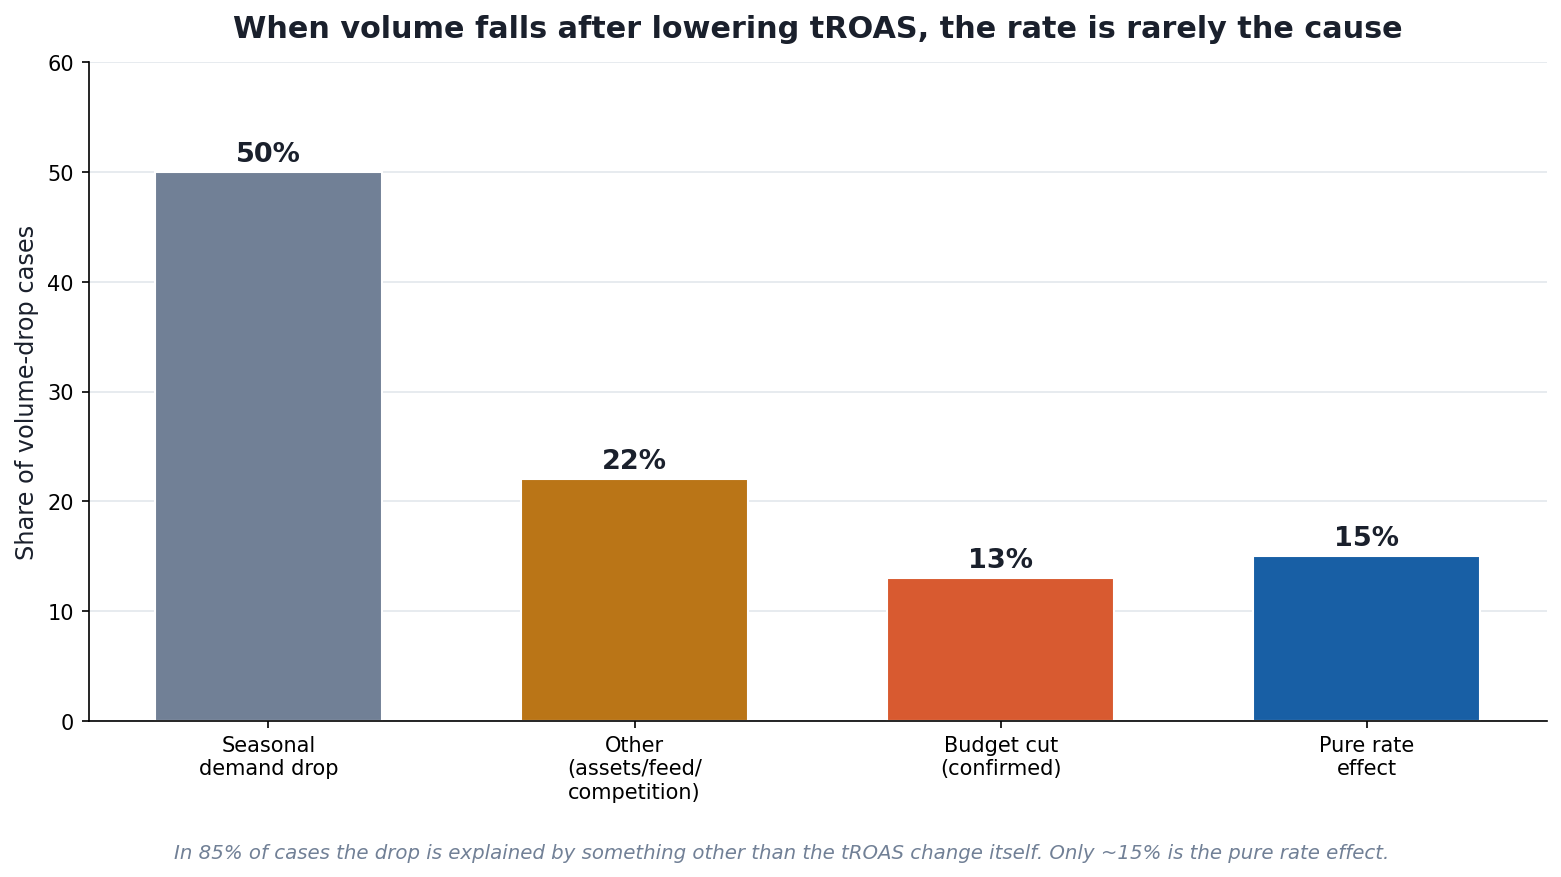
Why volume drops
In 85% of cases the volume drop is explained by something other than the bid. Before blaming tROAS, check seasonality and budget.
Finding 6. Performance Max and Shopping react in OPPOSITE directions
This is the most surprising one. The same action — lowering tROAS — produces opposite results in the two channels:
- Performance Max: volume +11% (lowering buys traffic), CPC +6%.
- Shopping: volume −17% (lowering cuts traffic), CPC barely moves.
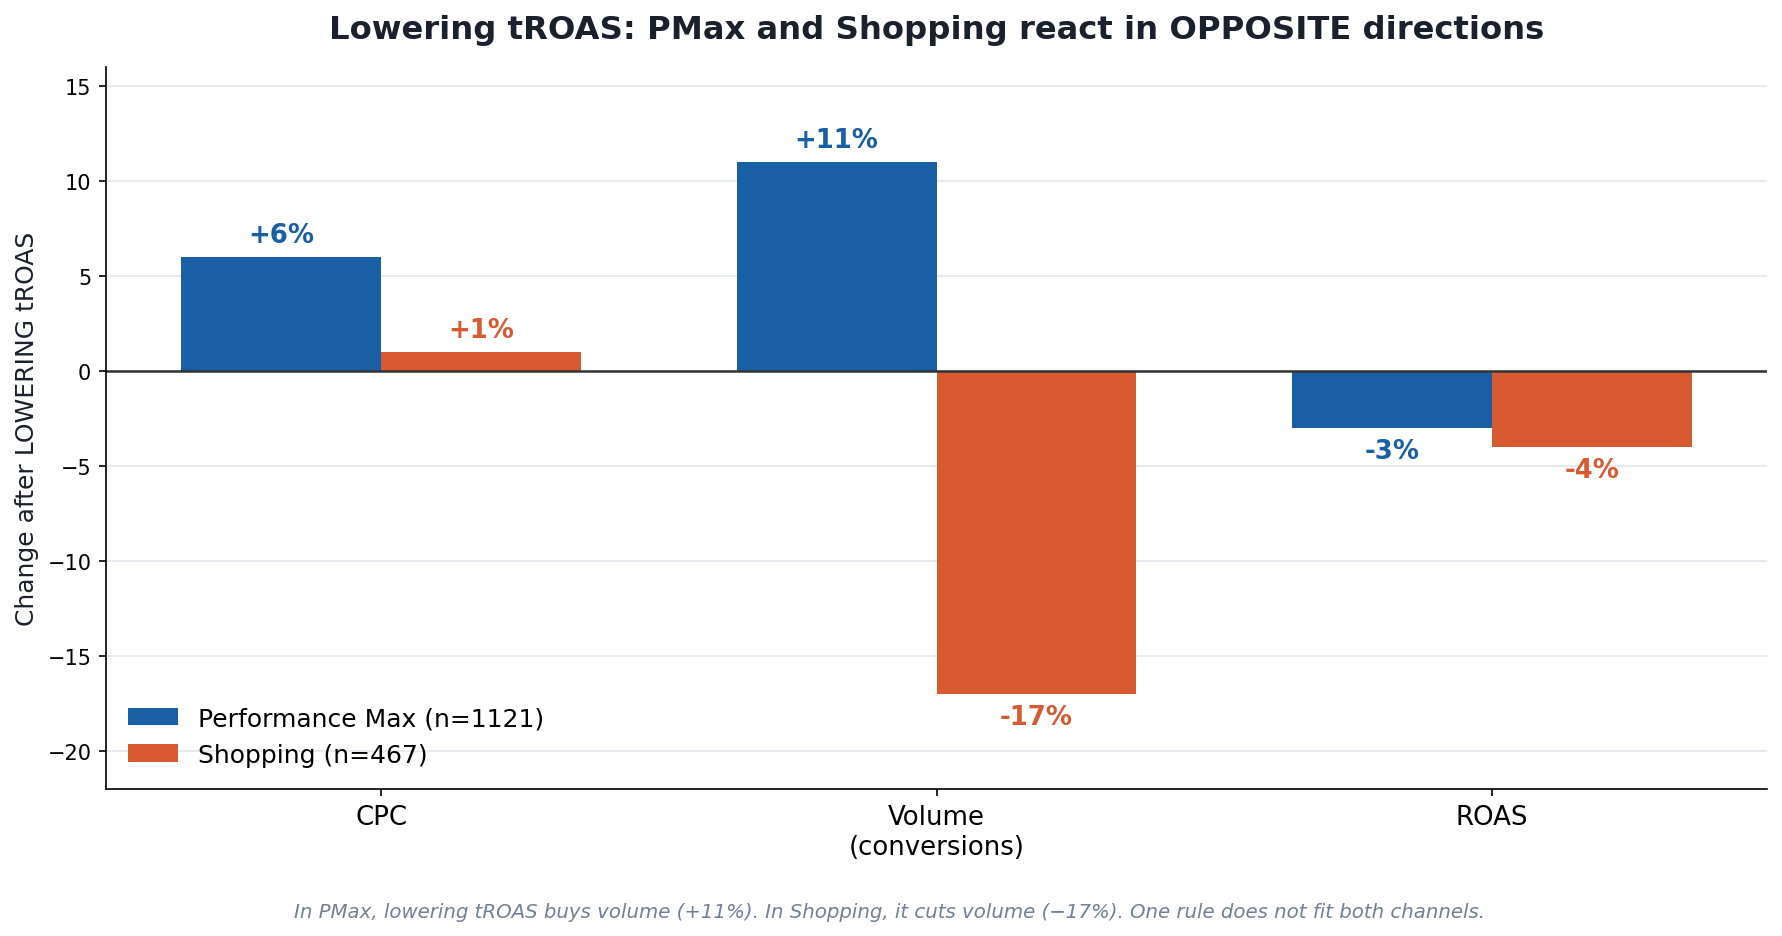
PMax vs Shopping
One rule does not fit both channels. “Lower the target for volume” is true for PMax but usually harmful for Shopping. This matters for anyone running both formats in the same account.
Finding 7. The system always under-delivers: transmission ≈ ⅓
A separate practical discovery. When the target is raised, actual ROAS rises, but always by less than the target was raised:
- raised the target by +10% → actual rose +3%;
- +30% → +11%;
- +60% → +19%.
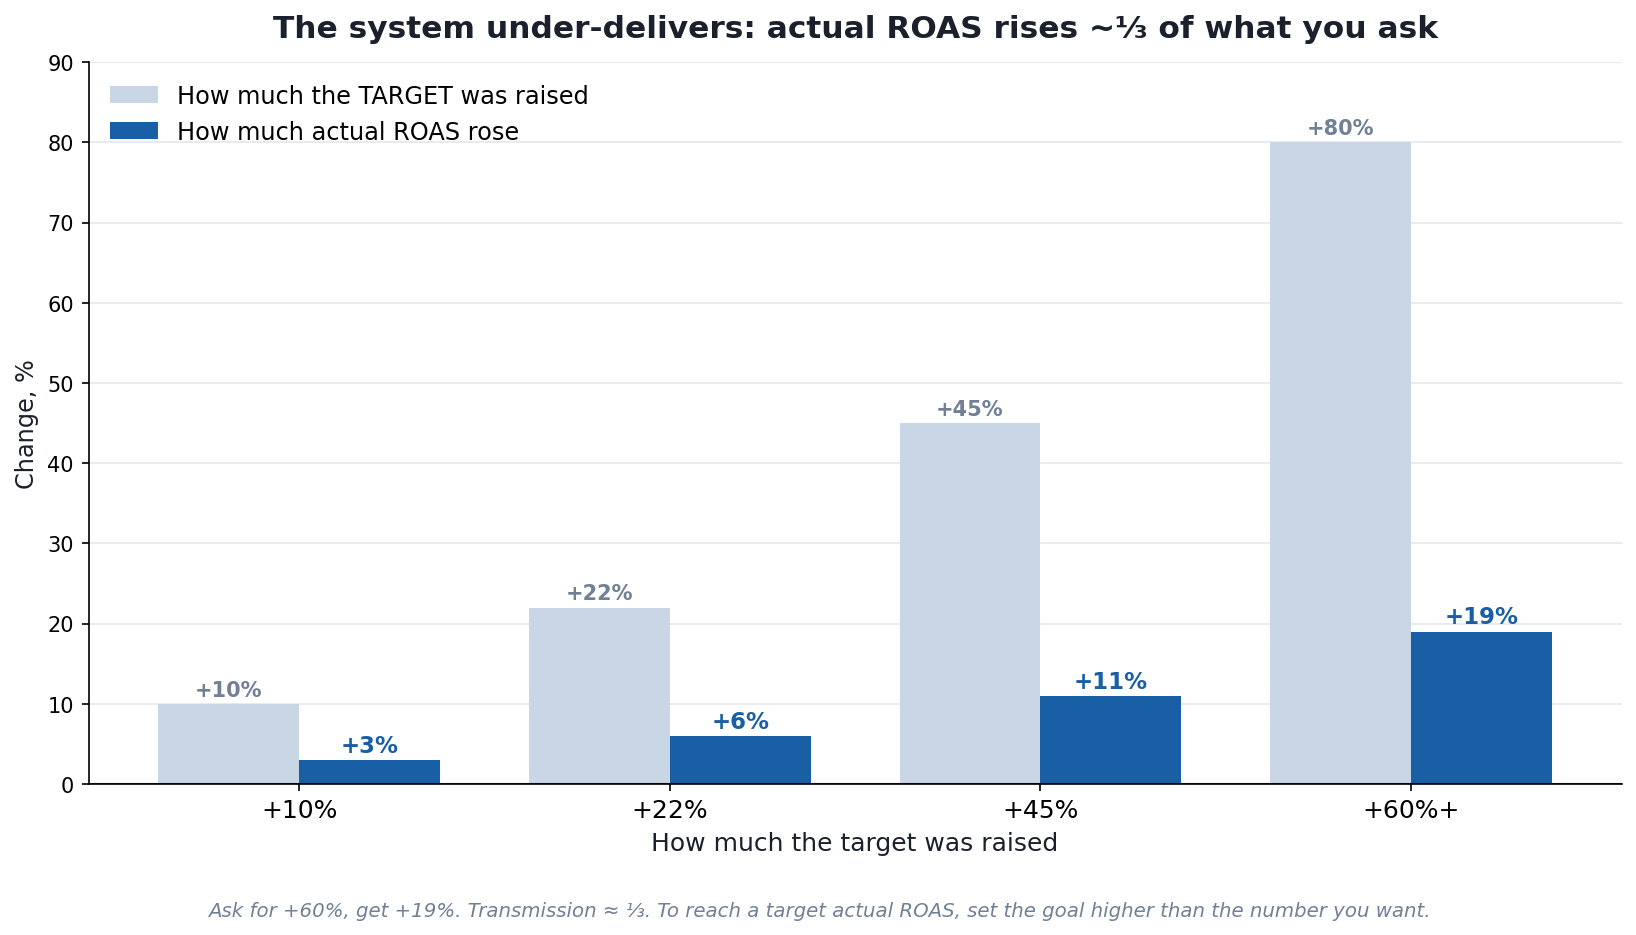
The system under-delivers
The real gain in actual ROAS is roughly a third of how much the target was raised. Hence the rule: to bring actual ROAS to a desired level, set the target higher than the number you want — the system never reaches the stated bar.
Finding 8. Overshooting the target is a trade-off, not a free gain
The higher the target sits above actual, the higher actual ROAS after the change (+3% → +15% → +32%). But at the same time volume (down to −15%) and spend (down to −27%) fall harder.
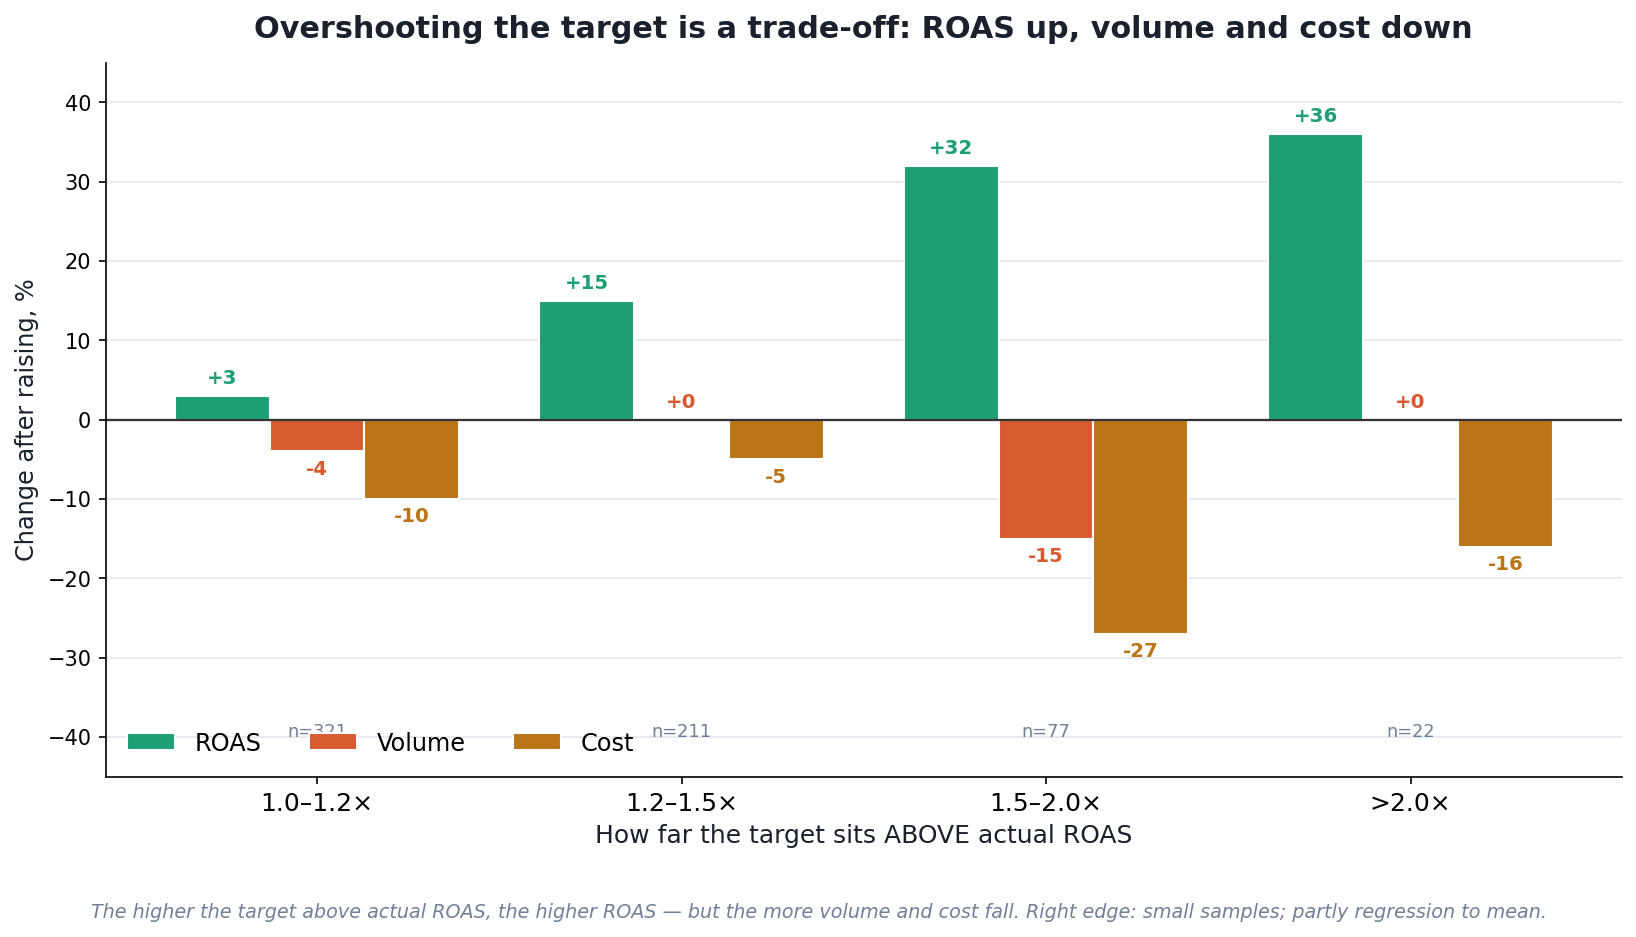
Overshooting is a trade-off
ROAS doesn’t come from nowhere. A target set far above reality forces the system to narrow to its most profitable core — percentage profitability rises, but at the cost of sales and turnover. It’s a deliberate trade of scale for efficiency, to be done with eyes open.
(Separately: average order value barely moves with tROAS changes — at the campaign level, tROAS does not pull AOV toward more expensive baskets.)
What about budget?
We measured it too (~40,000 changes). In short: budget scales volume but does not scale profitability — it dilutes it. When a budget increase actually grows spend, volume rises substantially (+36…+52%), but ROAS drops by −6…−8% (diminishing returns: new money enters more expensive auctions).
And crucially: budget works as a lever only if the campaign is capped by it (spending near 100%). If the campaign under-spends its budget, the bid is what constrains it, and raising the ceiling only hurts ROAS without adding volume.
What this means in practice
- Don’t manage profitability through tROAS. It governs volume and cost per click. Profitability is set by the starting position and structure, not by the target number.
- Look at the starting position, not the step. Actual below target → you can lower. At target → leave it. Above → there’s room for volume.
- Set the target with headroom. The system under-delivers (~⅓) — aim above your desired actual.
- Separate the channels. PMax and Shopping react oppositely — don’t transfer rules automatically.
- Before blaming the bid for a volume drop — check seasonality and budget. In 85% of cases it isn’t tROAS.
- Budget scales volume at the cost of ROAS — and only where the campaign is capped by it.
Honestly about the limitations
- All conclusions are at the campaign level (aggregate). What happens beneath that aggregate — at the level of individual products and channels inside PMax — is a separate question we’re researching next. For example, a “quiet” change in cost per click at the campaign level can mask opposing moves across individual products.
- Large drops and strong overshoots rest on smaller samples — figures there are weaker, and we flagged them.
- Part of the effect under strong overshoot is regression to the mean, not the pure effect of the bid.
- Impression share for Performance Max is almost always unavailable via the API, so the “budget-limited vs bid-limited” split relied on indirect markers.
We deliberately keep these limits visible: a study is stronger when it’s honest about what it hasn’t yet shown.
What’s next: analysis after August 17, 2026
This study captures the baseline “before 17.08.” The platform update taking effect on August 17, 2026 changes the rules for budget-limited campaigns: where a budget ceiling previously held actual ROAS above target and made the target “soft,” the system begins to couple target and actual more tightly.
We expect (and will verify on data after the deadline) that for budget-limited campaigns:
- the transmission coefficient will rise from ~⅓ toward 1 — actual ROAS will respond to a target change more directly, and the “set the target with headroom” rule will weaken;
- the sensitivity of cost per click to tROAS will sharpen, since the campaign will operate at the bid ceiling rather than below it;
- the direction of the PMax vs Shopping divergence will likely persist (it stems from differing inventory breadth), but the magnitudes will shift.
This is an ADW Service forecast, not a measured fact — which is exactly why we’ll continue the research in a separate piece after the update takes effect, with a “before / after” comparison on fresh data. The mechanics described above remain the foundation; only what related to the decoupling of target and actual via budget constraint will shift.
FAQ
-
Weakly and not reliably. Per ADW Service data, raising tROAS lifts actual ROAS by only ~5% at the median, and improvement happens in roughly 57% of cases. tROAS is a lever for volume and cost per click, not a direct lever for profitability.
-
It rises. For tROAS reductions of 5–20%, the median CPC increase is 5–8%. This is mechanical: loosening the target lets the system pay more per click.
-
Risky. Large drops (≤ −30%) produce unpredictable results — roughly 50/50 whether ROAS improves or worsens, with a wide spread. It’s safer to lower gradually while watching cost per click.
-
The channels react to lowering tROAS in opposite directions. In Performance Max lowering increases volume (+11%); in Shopping it decreases it (−17%). The same bidding strategy cannot be applied to both.
-
Set it with headroom — higher than the value you want. The system under-delivers: actual ROAS rises by roughly a third of how much you raised the target (transmission coefficient ≈ ⅓).
-
Only if the campaign is capped by its budget (spending near 100%). Then raising the budget scales volume (+36…+52%) but lowers ROAS by 6–8%. If the campaign under-spends, the bid constrains it, and raising the ceiling only dilutes profitability without adding volume.
-
In most cases the cause is not the bid. Per ADW Service data: ~50% seasonal demand drop, ~13% a simultaneous budget cut, ~22% other factors (asset groups, feed, competition), and only ~15% the actual effect of the bid reduction.
FAQ (practical phrasing)
-
Gradually, in small steps — not because the step affects profitability (it doesn’t), but because gradual raises are safer for volume and for the algorithm’s learning. Remember the system under-delivers: set the target with headroom above what you want. And expect the trade-off — raising the target almost always costs some volume.
-
Through tROAS itself — only to a limited degree: it lifts actual ROAS only by narrowing to the profitable core, i.e. at the cost of volume. The durable path to higher profitability is improving the inputs: higher average order value, better conversion rate, cheaper quality traffic, a cleaner product feed. tROAS only redistributes profitability — it doesn’t create it.
-
Lowering tROAS will NOT reduce CPC — on the contrary, loosening the target raises CPC by 5–8%. To lower CPC, the opposite levers work: raising the target, improving traffic quality, working on the feed and creatives.
-
t depends on what constrains the campaign. If it spends ~100% of its budget, the ceiling constrains it, so raise the budget. If it under-spends, the bid constrains it, so lower tROAS. Raising the budget of a campaign that already doesn’t spend its budget is pointless and harmful to ROAS.
-
With caution. Recommended values are often computed on a short data window and can be too high for a specific account. Anchor on the campaign’s own profitable core and the client’s business goal, not just the interface suggestion.
-
Target ROAS is the value you set as a guideline for the algorithm. Actual ROAS is the result the campaign actually delivered. They rarely match: actual depends on real auctions, demand and competition, not just the set target.
-
No, differently and even oppositely. Lowering tROAS increases volume in PMax and decreases it in Shopping. The bidding strategy must be chosen separately for each channel.
FAQ (specific situations)
-
With no data of your own, anchor on the economics: the break-even ROAS = 1 / margin (e.g. a 25% margin → break-even ROAS 400%), plus rough conversion benchmarks for the niche. Don’t set an ambitious high target right away — with no data the algorithm has nothing to learn from, and an inflated bar will choke learning. Start near break-even and raise as conversions accumulate.
-
Google’s recommendations are often computed on a short data window and prone to overfitting — they may reflect a temporary spike rather than the campaign’s sustained ability. The recommendation block is also generally geared toward increasing activity. So verify the recommended value against the campaign’s own profitable core rather than accepting it automatically.
-
The first ~2 weeks after a change are a learning period when metrics are unstable and unrepresentative. Evaluate the effect correctly from roughly day +15 through day +42. In our study we deliberately excluded the learning period to avoid attributing adaptation noise to the change.
-
At the campaign level — essentially no. Per ADW Service data, changing tROAS barely affects average order value (fluctuations within ±1–2% with no consistent direction). If tROAS does shift the product mix by price, it isn’t visible at the campaign aggregate.
-
That’s a sign of an inflated target — the campaign physically can’t reach it and is choking its own volume as a result. The fix: lower the target ROAS closer to the campaign’s real profitable core. Raising the budget won’t help here, because the bid — not the spending ceiling — is the constraint.
-
No. Each change triggers a learning period (~2 weeks of instability). Frequent adjustments keep the campaign in perpetual learning and prevent it from reaching a stable result. Change when needed and allow time to adapt between adjustments.
-
Look at budget utilization. Near 100% → the ceiling constrains it (lever: budget). Noticeably below (e.g. 40–60%) → the bid constrains it (lever: tROAS), and raising the budget will be pointless.
-
Yes, this is a typical scaling scenario. If the campaign is profitable (actual ROAS above target and above the business KPI) but under-spends, loosening tROAS lets the system take more traffic and grow volume, trading the profitability surplus for scale.
Glossary
Target ROAS (tROAS) — the profitability value set in a campaign’s settings that Google’s algorithm aims for while managing bids.
Actual ROAS — the real profitability a campaign delivered over a period (conversion value / cost).
Feasibility ratio (starting position) — the ratio of actual ROAS to target ROAS before a change. It shows where the campaign stands relative to the set goal: below 1 — the target is too high; near 1 — balanced; above 1 — there’s a profitability surplus. Per the ADW Service study, it’s the starting position, not the size of the change, that determines the outcome of a tROAS adjustment.
tROAS transmission coefficient — the fraction by which actual ROAS responds to a change in the target. Per ADW Service data it’s roughly ⅓: raising the target by N% shifts actual ROAS by about N/3%.
Profitability ↔ volume trade-off — the key property of tROAS: raising the target lifts actual ROAS at the cost of falling volume and spend, and vice versa. There is no free profitability gain through tROAS.
ADW Service — Google Premier Partner. This study is based on anonymized, aggregated advertising-account data for the period 2025–2026.