
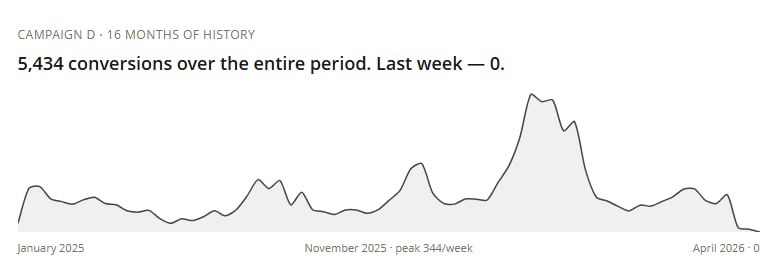
Picture a PMax campaign that runs for 16 months straight. No interruptions, no relaunches. 306 conversions per month on average. Total: 5,434 conversions, $105K USD in revenue.
By the usual industry shorthand, this campaign would look mature: enough conversion volume, a long operating history, no obvious learning-phase issue. In most PMax discussions, this would qualify as “trained,” “predictable,” “ready for tROAS at scale.”
In April 2026, this campaign produced 4 conversions per week. Not per day. Per week. The decline had been building for months — from peak 344 conv/week in November to effectively zero.
Not because of a broken tag. Not because the budget got cut. Because the metric used to measure PMax “maturity” doesn’t measure what most advertisers think it measures.
The problem isn’t that the 50+ conversion benchmark is useless. The problem is that advertisers often treat it as a maturity signal — and that’s where the metric becomes dangerous.
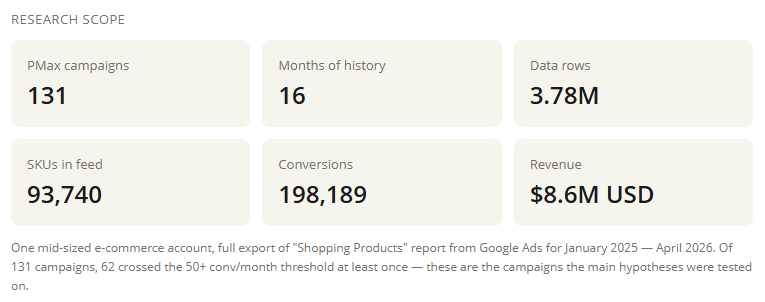
This article tests that assumption on 131 PMax campaigns from one account, 16 months of history, 3.78 million data rows, and 198,000 conversions. With a step-by-step method you can apply to your own campaigns in 15 minutes.
If you run PMax — buckle up. The next 12 minutes won’t be fun, but they’ll be worth it.
Where the 50/60 number comes from
The number isn’t pulled out of thin air. It has logic — which is exactly why it gets repeated. Most industry guides, webinars, and expert breakdowns converge on the same threshold: “50–60 conversions per month and the campaign enters a stable zone.” The exact number varies — some say 30, some 50, some 90 — but the underlying logic is always the same:
Smart Bidding optimizes toward conversion value relative to cost (depending on the bidding strategy). The algorithm needs enough conversion data to identify patterns in users, products, timing, devices, and context. With 5 conversions per month, there’s nothing to learn from. It bids blind.
This is technically correct. Google itself, in its Smart Bidding documentation, emphasizes that the algorithm needs statistically significant data to optimize properly. This isn’t marketing — it’s math. With three data points, any regression returns nonsense.
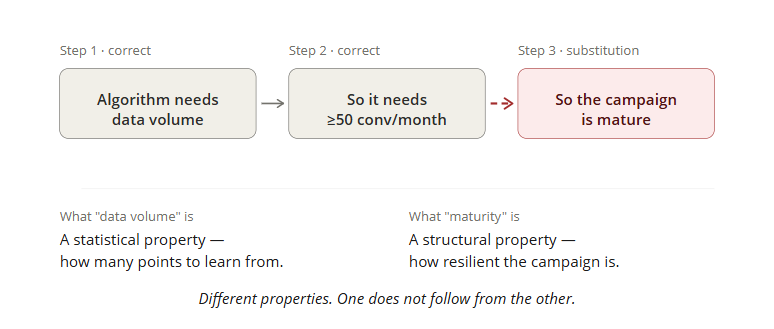
So where’s the gap? The gap is in the conclusion drawn from this fact.
The reasoning chain goes: “The algorithm needs volume → therefore 60+ conv/month → therefore campaign is mature → therefore predictable.” The first two arrows are correct. The third one substitutes one concept for another.
“The algorithm has enough data” ≠ “The campaign is mature.”
The first is a statistical learning property. The second is a structural resilience property. These are different things. A PMax campaign can hit 100 conversions per month, satisfy the threshold, and still — those 100 conversions can come from three or four SKUs that vanish from the feed next week. By Monday, your “mature” campaign is dead.
The aggregate metric only sees the final number: 100 last month, 100 this month, 100 next month. What’s happening inside is invisible to it. And inside is where the answer lives.
Most PMax maturity discussions stop at conversion volume. They rarely ask where those conversions come from inside the campaign. That’s the blind spot this article is about.
I didn’t arrive at this skepticism through theory. I arrived at it from the campaigns I actually run. When you keep watching campaigns with beautiful 250+ conv/month numbers collapse over two weeks, you start questioning the metric. I tested this systematically across 131 campaigns over 16 months. The picture turned out worse than I expected.
Methodology and numbers next.
What I did — methodology
A claim without explicit methodology is an opinion. So here are the parameters:
Methodology block · structured data
Parameter | Value |
|---|---|
Study type | Pilot study, single-account |
Sample | 131 PMax campaigns, one e-commerce account |
Period | January 2025 — April 2026 (16 months, 69 weeks) |
Data source | Google Ads, “Shopping Products” report |
Aggregation level | Campaign × item_id × week |
Total observations | 3,782,278 rows |
Active SKUs in feed | 93,740 |
Total conversions | 198,189 |
Total spend | ~$534K USD (21.9M UAH) |
Total revenue | ~$3.99M USD (163.6M UAH) |
Account-level ROAS | 7.47 |
Analysis tools | BigQuery (aggregation), Python/pandas (classification) |
All monetary values were originally recorded in UAH and converted at approximately 41 UAH/USD for readability. Minor differences may appear due to rounding.
From the 131 campaigns, I excluded those that never crossed the “50+ conv/month” threshold in any single month over 16 months. That left 62 campaigns — our sample of “formally mature” by the threshold criterion. These are the campaigns where I tested the hypothesis.
For each of the 62 campaigns, I calculated: – how many months had ≥50 conv (range: 1 to 16) – conversion distribution across SKUs in each month (top-1, top-3, top-5 shares) – number of SKUs with ≥3 conversions (a rough “assortment depth” metric) – crashes — months where the campaign lost ≥50% of conversions after at least one month with ≥50 conv – in parallel — monthly volume dynamics across the entire account, to distinguish “fell with everything” from “fell alone”
Campaign and SKU names are anonymized (Campaign A, B, C, D, E, F).
Sample limitations. This is a single-account pilot study. The results produce strong hypotheses, not definitive benchmarks. The 68/20/4 distribution reported below is this account’s profile, not an industry norm. I’m publishing the methodology now because it’s convincing enough at pilot scale — and because I’m collecting data from other accounts to scale the study. If you have data from your own PMax campaigns, get in touch — contact at the end of the article.
Now — what I found.
The first shock — 95% of “mature” campaigns crashed
The first hypothesis I tested was simple: “If the 50+ conv/month metric is bad, then campaigns that pass it should crash at the same rate as those that don’t. The threshold offers no protection.”
I expected to see something like a 60% vs 80% gap. Reality turned out more extreme.
Of 62 campaigns that crossed the 50+ conv/month threshold at least once: – 59 (95%) crashed by ≥50% at least once after becoming “mature” – 15 (24%) are effectively dead in the last 3 months of observation (zero or near-zero conversions) – In total — 112 distinct crashes across 62 campaigns (averaging 1.8 crashes per campaign over 16 months)
95% isn’t a “partially confirmed hypothesis.” It’s a complete collapse of the protection hypothesis. In this sample, crossing the 50+ conv/month threshold did not behave as a protection signal against later drops. Roughly one in twenty campaigns survived 16 months without crashing. The other nineteen crashed at least once.
I could have triumphantly written “see, the threshold is a lie” and moved to conclusions. But I ran a second check — one I expected to confirm my view — and it gave me the most important part of the story.
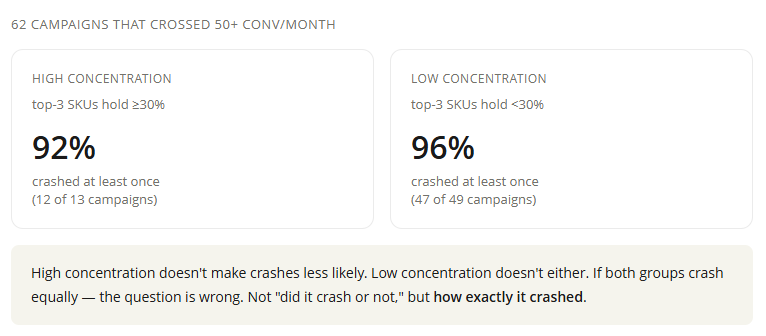
Second hypothesis: “Maybe campaigns with low concentration of conversions (top-3 SKUs holding less than 30%) crash less often.” Simple logic — if a campaign rests on many SKUs, the disappearance of one or two shouldn’t take everything down.
I checked: – of 13 campaigns with high concentration (top-3 ≥30%) — 12 crashed. That’s 92%. – of 49 campaigns with low concentration (top-3 <30%) — 47 crashed. That’s 96%.
96% vs 92%. Low concentration doesn’t protect either.
This is where my first version of this article fell apart. It was supposed to be a simple story: “look, the diversity metric saves you where the 50+ threshold doesn’t.” The data said otherwise — diversity alone doesn’t save you either.
Honest research has moments where you have to stop and ask: am I asking the right question? I asked. And realized I was asking it wrong.
“Did the campaign crash or not” is a binary question that explains nothing. The question that matters is HOW it crashed. Because if one campaign fell along with the entire account (budget cut), and another fell on its own while the rest of the account stayed healthy — those are different crashes with different causes.
I rebuilt the analysis from scratch. This time I classified each of the 112 crashes by diagnostic signals. What came out — in the next section.
PMax Crash Classification — three failure modes
What I’m about to describe is my own framework, derived from the 131-campaign study. I’m naming the method PMax Crash Classification (henceforth PCC) — so we have something to reference in subsequent articles and in your own practice. This is a classification framework, not a panacea. Its value is precisely that it distinguishes between different failure modes instead of measuring all of them with one metric.
PMax Crash Classification (PCC) is a diagnostic framework that classifies Performance Max campaign failures into three mechanisms — systemic, structural, and contextual — based on two diagnostic axes: account-level conversion volume change and top-3 SKU activity status.
For each of the 112 crashes, I checked two signals simultaneously:
- What happened to the entire account in the same month? If account-level volume dropped ≥25% — the cause is likely systemic (budget, restructuring, external event). If the account was fine — the cause sits inside the campaign.
- What happened to the top-3 SKUs of that campaign? If they vanished from the feed (impressions = 0) or stopped converting — structural fragility. If they’re still active — the cause is somewhere else.
Combining these two signals gave a clear picture of three different failure modes:
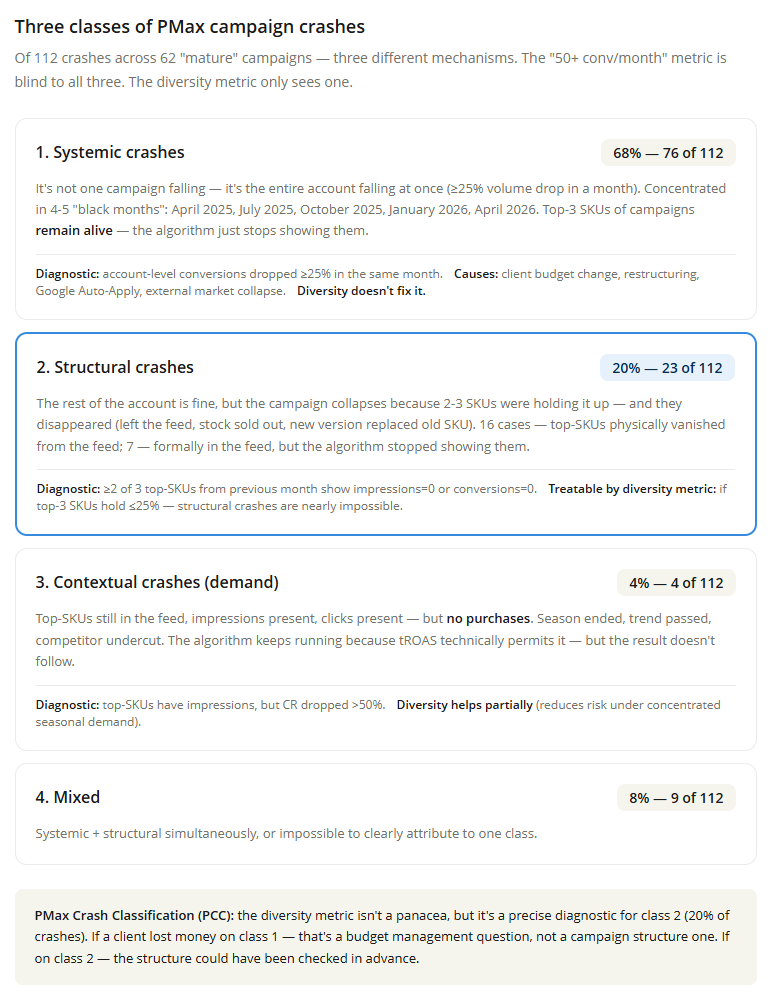
1. Systemic crashes — 68% (76 of 112)
This is when it’s not one campaign falling — it’s the entire account falling at once. On this account, there were five systemic events over 16 months: April 2025 (-30% volume), July 2025 (-38%), October 2025 (-32%), January 2026 (-47%), April 2026 (-41%, current month, incomplete).
I know the cause for two of them: April 2025 — client cut budgets, January 2026 — feed restructuring. The rest are partly seasonal dips, partly unknown external events.
Worth noting: the top-3 SKUs of campaigns that crashed systemically stay alive — impressions present, clicks present. The algorithm just stops showing ads as aggressively because account-level conditions changed. This is outside the campaign structure’s control. The diversity metric doesn’t fix systemic crashes — they can’t be “treated,” only diagnosed and explained to the client.
2. Structural crashes — 20% (23 of 112)
This is when the rest of the account is fine, but the campaign collapses because 2-3 SKUs were holding it up — and they disappeared. In 16 cases, SKUs physically vanished from the feed (stock sold out, new version replaced old SKU, item discontinued). In 7 cases, SKUs are formally in the feed but the algorithm stopped showing them — CTR dropped, ranking fell, or competitors squeezed them out.
This is the fragility the “50+ conv/month” metric hides. A campaign can hold 250 conv/month for ten months, qualify as “formally mature” — and the entire time be resting on three positions. The month those three disappear, the campaign goes to zero.
Structural crashes are the diversity metric’s strongest use case. If top-3 SKUs hold ≤25% and the campaign has at least 10 SKUs with ≥3 conversions, losing one or two positions doesn’t kill the campaign — the algorithm has alternatives. This is the most controllable part of PMax risk.
3. Contextual crashes — 4% (4 of 112)
The rarest class, but conceptually important. Top SKUs are still in the feed, impressions present, clicks present — but no purchases. Season ended. Trend passed. Competitor undercut prices. The algorithm keeps running because tROAS technically permits it — but the result doesn’t follow.
Diversity helps partially here: if a campaign rests on a wide range rather than seasonal items, contextual crashes are less likely. But if the entire segment is in decline, that’s not a diversity problem — that’s marketing reality.
4. Mixed — 8% (9 of 112)
Cases where multiple causes overlap simultaneously: systemic month + concurrent top-SKU disappearance + seasonality. Distinguishing which of the three is decisive is impossible. I’m flagging them separately rather than hiding them in one of the main categories — which is what most blogs do.
Classification summary
The “50+ conv/month” metric is blind to all four PCC categories. The diversity metric sees exactly two of them (structural + partially contextual) and doesn’t see systemic crashes at all.
This is the logic of PMax Crash Classification. Not “use diversity instead of 50+” — that would be the same mistake at a different level. It’s “build a diagnostic dashboard from multiple signals, each one seeing its own type of risk.”
Six cases — six storylines
Classification is dry. Let’s anchor it in six real campaigns from the sample, one per archetype. All data anonymized — Campaigns A, B, C, D, E, F. Charts below show real weekly data, not simulations.
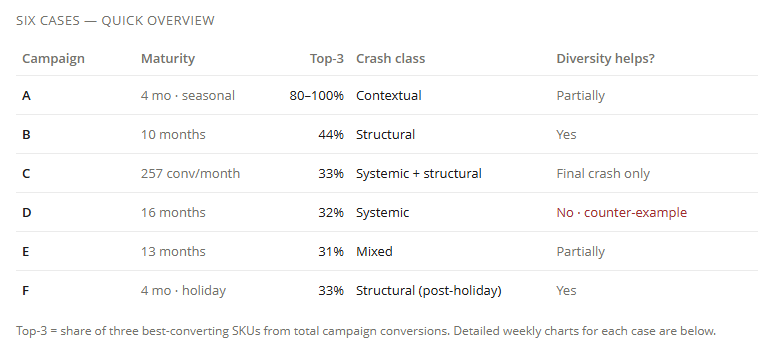
Campaign A — 4 months mature, seasonal peak
Campaign A · 4 months maturity, seasonal peak
Total conversions
1,157
Top-1 SKU held
51%
Peak conv/week
218
Last 4 weeks
0
What we see: the campaign woke up in mid-November 2025 along with seasonal demand for the category. Peak of 218 conv/week in December. Top-3 SKUs held 80-100% of total volume — the campaign was essentially built on three seasonal items, nothing else sold. After February 9, 2026 — these items are technically alive (impressions in feed exist), but conversions dropped to zero. Season ended — campaign died.
The campaign woke up in mid-November 2025 alongside a seasonal demand spike. Within six weeks it scaled from zero to 218 conv/week. Four straight months at ≥50 conv/month — formally “mature.” The aggregate volume metric showed a perfect picture.
Now the punchline: top-3 SKUs held 80–100% of total volume the entire time. The campaign wasn’t built on a wide assortment — it was built on three seasonal positions. Nothing else. As long as the season held, everything worked. In February 2026 demand vanished — and the campaign zeroed out within two weeks.
Top-3 SKUs are still formally alive in the feed. People just don’t buy them anymore. This is the contextual class — not “products disappeared” but “demand disappeared.” The diversity metric helps partially here: if the campaign had backup non-seasonal inventory, the crash would have been gradual instead of catastrophic.
Campaign B — 10 months of stable maturity
Campaign B · 10 months of stable maturity
Total conversions
1,676
Top-3 SKUs held
44%
Months ≥50 conv
10
Drop
−100%
What is visible: the campaign steadily maintained 30-70 conv/week from March through November 2025 — 10 months of "maturity" by the sum-metric. The top-3 SKUs held 44% of all conversions, and their weekly share fluctuated 50-80% — already a signal of internal fragility that the sum-metric doesn't show. In the week of December 8-15, 2025, all three top SKUs made their last conversion, then disappeared from the feed. In January 2026 — zero. 10 months of tenure didn't save it, because the entire campaign rested on three positions.
This is the best example of why the “50+ conv/month” metric is misleading. The campaign held 30–70 conv/week from March through November 2025 — ten months of “maturity” with a median of 166 conv/month. By any conventional volume benchmark, this campaign looked well-established.
But there’s one signal an expert wouldn’t have looked at — top-3 SKU share. It steadily held at 50–80%. Translated: for all ten months of maturity, the campaign rested on three positions. The rest of the assortment was decoration.
In the week of December 8–15, 2025, all three top SKUs vanished from the feed simultaneously. Maybe inventory sold out. Maybe a new version replaced the old SKU. The exact cause isn’t visible in the data — only the fact: after that week, the campaign produced a few inertia conversions and stopped. January: zero. Ten months of maturity didn’t save it, because the entire maturity rested on three positions.
This is a clean structural class — the diversity metric’s best use case. If top-3 had held ≤25%, three SKUs disappearing wouldn’t have killed the campaign — the algorithm would have had something to switch to.
Campaign C — 257 conv/month, 5× over the threshold
Campaign C · 257 conv/mo — far above the author's threshold
Total conversions
2,896
Top-3 SKU held
33%
Median conv/mo
257
Budget for period
270k UAH
What is visible: this campaign had a median of 257 conv/mo — five times higher than the "60+ conv/mo" threshold that many guides present as the safe zone. And still — 5 drops in a row. The first 4 (April, July, October 2025, January 2026) were systemic, synchronized with drops across the entire account: April — budget cut, January — restructuring. But the final collapse in February 2026 was already structural: all 3 top SKUs disappeared from the feed, the campaign reset completely.
If anyone tells you “50+ conv/month is too low, we have 200+, we’re fine” — show them this campaign. Median 257 conversions per month, five times the threshold. Total 2,896 conversions over 16 months.
And five consecutive crashes. The first four are systemic, synchronized with account-wide drops: April 2025 (budget cut), July, October 2025, January 2026 (restructuring). The campaign rebuilt within two-three weeks each time because it had a solid base.
But the final crash in February 2026 was structural. All three top SKUs disappeared from the feed at once. The campaign couldn’t recover — and two months later, at the time of writing, it’s still producing 0 conv/week.
A high absolute conversion number proves nothing about resilience. 257 per month can be 3 SKUs at 85 each, who’ll vanish next month. Or it can be 50 SKUs at 5 each, any of which is replaceable.
Campaign D — 16 months mature, the counter-example
Campaign D · 16 months of continuous maturity — the most mature in the catalog
Total conversions
5,434
Top-3 SKU held
32%
Median conv/month
306
Budget
591k UAH
What we see: Counter-example! The best campaign in the catalog. 16 months ≥50 conv/month, median 306, top-3 SKU = 32% (below the "dangerous" threshold). Top-3 SKU still alive as of April 2026. And yet — 5 drops, all 5 systemic. The campaign fell from 344 conv/week in November to 4-5 in April due to account-level events, not campaign structure. Conclusion for the article: diversity metric is not a panacea. It protects against class 2 (structural), but class 1 (systemic) — beyond its control.
Now a campaign that disproves my own thesis — which is why I’m showing it. The most mature campaign in the catalog. 16 months of uninterrupted maturity. Median 306 conv/month. Top-3 SKUs at 32% — below the “danger” threshold of 30%, on the edge. Top-3 SKUs are still active as of April 2026.
If the diversity metric were a panacea, this campaign wouldn’t have crashed. But it did. From 344 conv/week in November 2025 to 4 in April 2026.
Why? Because all five of its crashes are systemic. It rode through budget cuts and restructuring along with the rest of the account. SKU disappearance didn’t affect it — its top-3 are intact. Decisions outside the campaign’s structure affected it.
This is an honest counter-example. Diversity isn’t a panacea. It protects against class 2 (structural), partially against class 3 (contextual), and not at all against class 1 (systemic). If the client cuts the budget by 30%, the world’s best campaign structure produces -30%, not +10%.
Campaign E — 13 months, moderate concentration, mixed crash
Campaign E · 13 months of maturity, moderate concentration
Total conversions
2,262
Top-3 SKU held
31%
Months ≥50 conv
13
Budget
351k UAH
What we see: the campaign maintained 30-105 conv/week from spring 2025 through the New Year holidays. Top-3 = 31%, at the edge of the "safe" zone. In January 2026 — a 94% collapse along with the entire account (restructuring). Top-3 SKUs stopped receiving conversions in one week on 22.12.2025 — in fact, the collapse already happened in the week after the holidays. This is a mixed case: seasonality + restructuring + SKU disappearance overlapped. It's impossible to distinguish which of the three was decisive. That's why separate diagnostic signals are needed, not just one metric.
The campaign held 30–105 conv/week from spring 2025 through New Year. Top-3 at 31%, on the edge of the safe zone but not over it. Thirteen months of maturity.
In January 2026, a 94% crash. But clean classification fails here: it’s simultaneously (a) a systemic month with restructuring, (b) post-holiday demand decline, and (c) top-3 SKUs stopped converting after December 22.
Did demand vanish? Yes. Did the structure break? Yes. Did account-level decisions affect it? Yes. Distinguishing which of the three was decisive is impossible. This is the mixed class. I’m flagging it honestly rather than hiding it under one of the main categories.
Campaign F — post-holiday collapse
Campaign F · 4 months maturity, holiday peak
Total conversions
1,998
Top-3 SKU held
33%
Peak conv/week
283
Budget
202k UAH
What we see: classic post-holiday collapse. The campaign ramped up in November (growth from 30 to 283 conv/week), peaked at the end of December. After January 12, 2026 — top-3 SKUs disappeared from the feed completely because holiday stock sold out. Campaign is dead. This is a pure structural class — not systemic, because the account only dropped 10% in February, while this campaign dropped 100%. This is the case that is predictable in advance: concentration grew from November, reached 70-100% by December — early diagnosis would have signaled "prepare second-tier assortment for after holidays".
The classic storyline that repeats every January in many e-commerce shops. The campaign ramped up in November (from 30 to 283 conv/week), peaked in late December. After January 12, 2026, top-3 SKUs vanished from the feed entirely — the holiday inventory sold through. Campaign dead.
This is a structural class, not systemic — because the account in February only dropped 10%, while this campaign dropped 100%. Same pattern as Campaign B, but with a seasonal accelerant.
This case is the best illustration of “predictability.” Concentration was rising from November, hit 70–100% by December. If you’d been monitoring this signal weekly, you’d have had two-three weeks of warning before the crash: “Get a second wave of inventory ready, you’ll need backup after the holidays.” No standard Google Ads metric — not conversions, not ROAS, not cost — provides this signal.
How to calculate diversity for your own account
Now the practical part. If everything above seemed convincing, here’s how to check your own campaigns in 15 minutes.
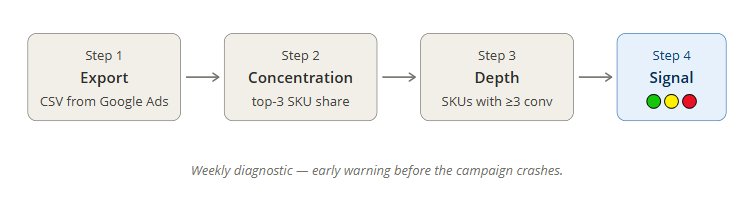
Quick method: Google Ads + Excel/Google Sheets (15 min per campaign)
Step 1. In Google Ads, open the report “Reports → Predefined → Shopping → Products.” Set the period to last 30 days.
Step 2. Export to CSV. Required columns: item_id, campaign, conversions, cost, conversion value.
Step 3. In Excel/Sheets, for each campaign: sort by conversions descending. Calculate: – sum of all conversions (TOTAL_CONV) – sum of top-3 conversions (TOP3_CONV) – top-3 share = TOP3_CONV / TOTAL_CONV – count of SKUs with ≥3 conversions
Step 4. Read the signals:
Signal | Green | Yellow | Red |
|---|---|---|---|
Top-3 SKU share | < 25% | 25–35% | ≥ 35% |
SKUs with ≥3 conv | ≥ 15 | 7–14 | ≤ 6 |
Share of SKUs with zero conversions (of total active) | < 60% | 60–80% | > 80% |
If any one indicator is red, the campaign is structurally fragile — even if absolute conversion volume is large. If two or three are red, start planning restructuring now, don’t wait for the crash.
If you have 50+ campaigns
The Excel method works up to a certain scale. If you manage a portfolio of 50+ PMax campaigns or multiple accounts, manual processing becomes a full work day every week. At that point you need automation: Google Ads Data Transfer → BigQuery, weekly classification query, Looker Studio with alerts.
I built this automation for my agency portfolio — it saves me several hours per week. If you want to discuss how to adapt it to your scale, get in touch. That’s a separate story I’m not telling in this article.
What to do with this
PCC diagnostics is not a one-time check. It’s the basis for weekly monitoring. Top-3 SKU behavior isn’t static — the share can drift up over weeks until it crosses into red. If you see a trend of 25% → 30% → 35% over three weeks, that’s an early warning before the campaign crashes, not an explanation after.
What to do for each PCC crash class
Suppose a campaign has already crashed. Your decision depends on which PCC class it belongs to.
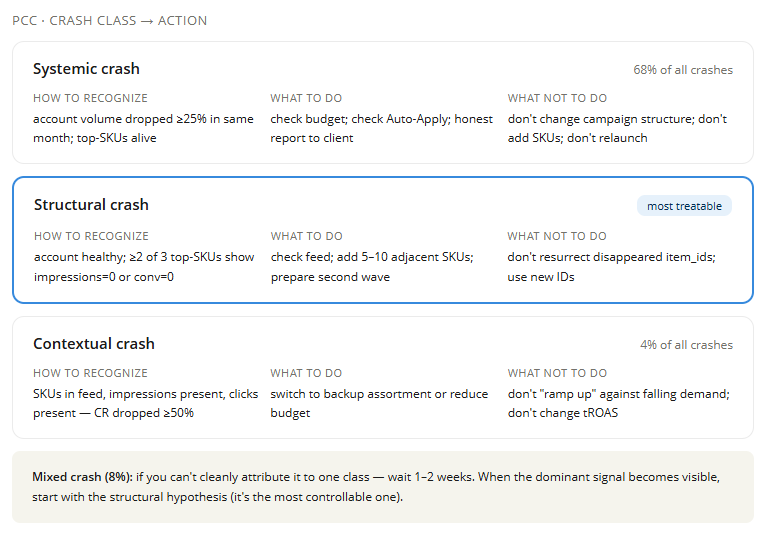
Systemic crash
How to recognize: account-level conversion volume dropped ≥25% in the same month. Your campaign’s top SKUs are still active (impressions > 0).
What to do: – First — stay calm. You didn’t break the campaign. External conditions did. – Check the account budget over the last month — the client may have cut spend without notifying the marketing team. This happens more often than you think. – Check Google Auto-Apply — it has a habit of changing tROAS without obvious notice. Go to Recommendations → Auto-applied, review the history. – If the cause is known (intentional budget cut, feed restructuring, platform migration), send the client an honest report: “Volume dropped because of X. Structure isn’t broken. Restoring budget restores volume.”
What NOT to do: don’t start “treating” the campaign structure. Don’t add new SKUs, don’t change tROAS, don’t relaunch. Systemic crashes need to be waited out — the campaign recovers when conditions recover. Active “treatment” at this moment only confuses the algorithm.
Structural crash
How to recognize: the account was healthy but your campaign zeroed out. ≥2 of the 3 top SKUs from the previous month show impressions=0 or conversions=0.
What to do: – Quick: check the feed. Did products vanish? Did stock sell out? Did a new version replace the old item ID? This is an e-commerce-side fix, not a Google Ads one. – Medium: add 5–10 new SKUs from adjacent assortment to the campaign. Not “throw in everything” — add products similar by category, price, type to the ones that were working. The algorithm needs similar context to retrain. – Strategic: for every campaign with top-3 ≥ 30% (per the diagnostic in section 7), plan a “second wave” in advance. Don’t wait for the crash — while the campaign is green, add backup assortment and watch which of it scales.
What NOT to do: don’t try to “resurrect” disappeared SKUs with the same item_id. If stock physically ran out, use a new item_id for the new product, don’t try to revive the old card. The algorithm associates data with specific item_ids — it won’t know you intended this to be a continuation of “the same” product.
Contextual crash
How to recognize: top SKUs are still in the feed, impressions present, clicks present — but CR (conversion rate) dropped ≥50%. This signals demand decline, not structural breakage.
What to do: – Most often, do nothing. If it’s seasonality (holidays ended, fashion shifted, trend passed), PMax can’t fix demand. Trying to “ramp up” a campaign against falling demand just burns budget. – If you have backup assortment, switch the campaign to it. Not back to the same dead peak that already had its day. – Temporarily reduce the budget to a minimum to stop feeding the algorithm data from a dying category. – Return to full budget when demand returns — you’ll see it in organic search trends, in competitor activity, in the seasonal calendar.
What NOT to do: don’t change tROAS trying to “unblock” the algorithm. If people aren’t buying at tROAS 800%, they won’t buy at 600% either. You’ll just overpay for failed clicks.
Mixed crash
If you can’t cleanly attribute a crash to one class, that’s a signal that there isn’t enough data for a decision yet, not that you should do everything at once. Wait 1–2 weeks for the dominant signal to emerge. If after two weeks it’s still unclear, start with the structural hypothesis (it’s the most controllable one) — and if it doesn’t help, switch to the contextual strategy (reduce budget and redirect).
PCC’s domain of applicability
Any classification framework has explicit boundaries where it works. Here are the boundaries of PMax Crash Classification — so you know where the method gives a precise answer and where it needs adaptation.
PCC works as-is when: – the account has at least 12 months of history and 50+ active PMax campaigns – product-level data is available (Google Ads Data Transfer or “Products” report export) – e-commerce with SKU-level tracking (lead generation needs separate adaptation)
PCC needs adaptation when: – you have less than 6 months of data. The classification logic is the same, but the 68/20/4 distribution is the source account’s profile, not a normative benchmark. Your distribution will be your own. The method is universal — the proportions are contextual. – you have 5–10 campaigns. The method works, but the sample is too small to see statistically significant patterns. Use PCC for individual crash classification, not for distribution percentages.
Account-wide drop months always need context. On this account, systemic events had known causes — April 2025 (client cut budgets) and January 2026 (feed restructuring). On your account, the causes will be different. The signal “account-level volume dropped ≥25%” is universal. Interpreting the cause is always your work — these months should never be diagnosed from campaign-level data alone.
Diversity is one of three signals, not the only one. PCC is built on two diagnostic axes (account-level + top-3 SKU). A complete monitoring dashboard would also include impression-trend per SKU and ROAS spread between top-3 and the rest. I deliberately limited this article to the most accessible signals — the full version of the dashboard is the next article.
Conclusion
The “50+ conv/month” threshold is a useful starting reference point, not a safety zone. You don’t have enough data for tROAS until you cross it. But you don’t have a structurally resilient campaign even after you cross it. Different levels.
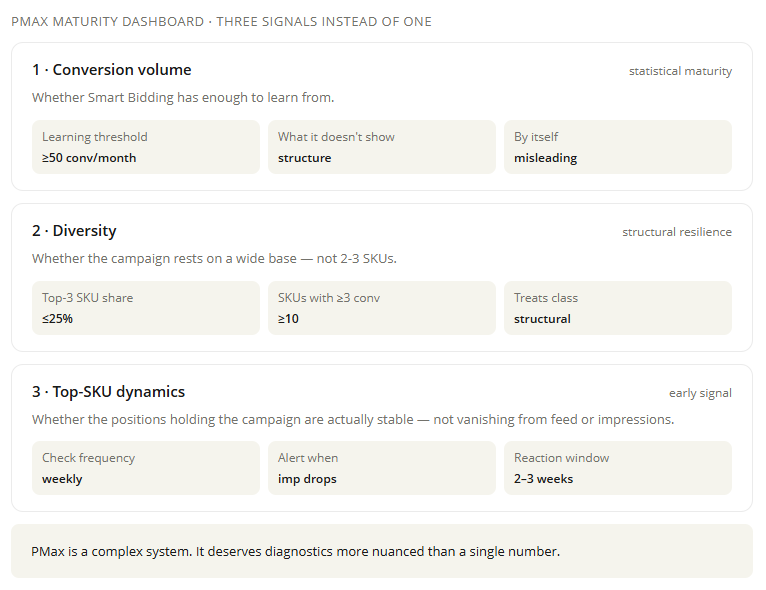
The real indicator of PMax maturity is a combination of three signals: 1. Conversion volume — does the algorithm have enough to learn from 2. Diversity metric — is the campaign built on a wide base (top-3 ≤ 25%, ≥10 SKUs with ≥3 conv) 3. Top-SKU dynamics — are the positions holding the campaign actually stable
A volume metric without structural diagnostics is like a doctor who only takes your temperature. They’ll tell you something, but not enough. And definitely not whether your body is ready for a workout.
PMax Crash Classification (PCC) gives a framework where most campaign drops can be diagnosed through one of three primary failure modes — systemic, structural, or contextual — so you can choose an adequate response instead of generic “we need to do something.”
If you have 5+ PMax campaigns, walk through them with my method and look at your account through the lens of these three signals, not just one. If you find interesting patterns, get in touch. I’m collecting cases for the next study, in which I plan to test: – whether the 68/20/4 distribution holds across a broader account sample – how the picture shifts when recalculated through POAS (Profit on Ad Spend) instead of revenue — this is the next article
PMax is a complex system. It deserves diagnostics more nuanced than a single number.
FAQ
-
Depends on which risk class you want to control. For statistical learning of Smart Bidding — yes, you need 50–60 conv/month. For structural resilience — that’s a necessary but not sufficient condition. Real maturity comes when the campaign has at least 10 SKUs with ≥3 conversions and top-3 SKUs hold ≤25–30% of volume. Different parameters.
-
One of the three classes in PMax Crash Classification. It’s a campaign drop of ≥50% while the account’s overall conversion volume in the same month didn’t change significantly. Most common cause: top-3 SKUs of that campaign vanished from the feed or stopped converting. Distinguish it by checking two signals at once: account-level volume + top-SKU impressions.
-
Not always. If the top-3 are stable non-seasonal items consistently in stock (a base catalog, for example), concentration is less critical. The risk grows when top-3 are seasonal, on promotion, dependent on a specific campaign event, or tied to a single supplier. Check not just the share but the risks of the positions themselves.
-
Sometimes yes. During seasonal transitions, after out-of-stock events, or when top SKUs disappear, tROAS can choke the algorithm where Maximize Conversions gives it a chance to retrain on new assortment. But this is a temporary tactic, not a permanent strategy. As soon as the new structure stabilizes and produces 30+ conv/month, switch back to tROAS.
-
Weekly minimum. During pre-holiday seasons (November–December for most e-commerce), twice a week. After every feed change (new SKUs added/removed, categories updated, platform migration), check again within a week.
-
The article focuses on e-commerce because SKUs are obvious there. For lead generation, the same logic applies, but “SKU” becomes “lead type” / “service category” / “form.” Diversity by lead type is also a working signal — just slightly more complex to compute.
-
PCC is a classification framework I developed based on analyzing 131 PMax campaigns over 16 months. It distinguishes three mechanisms behind PMax campaign failures — systemic (68% of crashes in my study), structural (20%), and contextual (4%) — so for each type you can choose an adequate response instead of generic “do something.” The classification + recommended actions are in sections 5 and 8.