Executive Summary
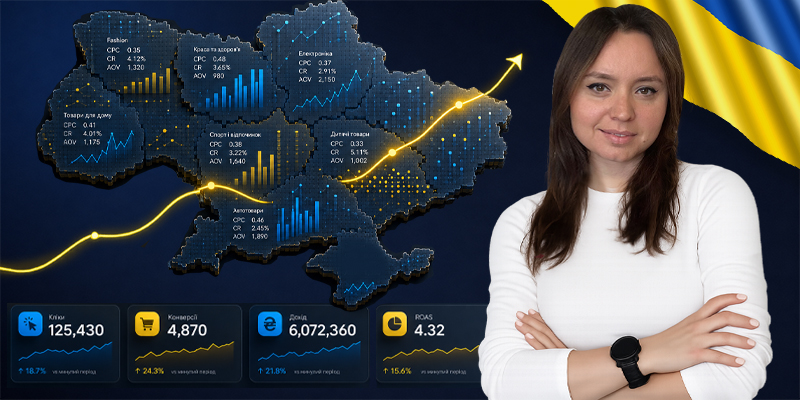
Ukraine’s e-commerce market in 2025–26 looks different from how public reports portray it. ADWService analyzed Google Ads accounts of Ukrainian online retailers over the period May 2024 – April 2026 and identified five shifts shaping the market:
- Ukrainian shoppers buy less often but spend more per order. The average order value (AOV) in Google Shopping/PMax rose +33% in UAH (+28% in USD) year-over-year — from $28 to $35 (₴1,121 to ₴1,497) — while the number of conversions fell 18%. The 5-point UAH/USD gap reflects hryvnia depreciation of roughly 4% between periods.
- Ukrainian e-commerce ROAS reached 8.19x in 2025–26. That is 19% higher than the prior year (6.86x). ROAS is currency-neutral.
- Ukrainian e-commerce is 90% mobile. Desktop advertising in Google Shopping delivers only 10% of clicks and 16% of revenue.
- December 2025 was the single biggest month in 24 months. Revenue hit ₴11.74M ($278K) — up 53.5% in UAH versus December 2024. Black Friday is fading as a sales driver.
- Stores with professional Google Ads management grow faster than the overall market. Revenue across tracked accounts grew +9.5% in UAH (+5% in USD), while Ukraine’s total online market grew 7% (per UNN). That is about 35% faster than the market average in local currency.
The dataset covers several dozen Ukrainian e-commerce advertising accounts with combined revenue exceeding ₴1.5B ($36M+) over the last 12 months.
Note on the Ukrainian context: This data reflects an economy operating under wartime conditions, including periodic power outages (“blackouts”) that have reshaped consumer demand. Where relevant, this report separates blackout-driven demand from underlying consumer trends to reveal what is genuinely changing in the market.
Methodology
Data source
This study is based on Google Ads accounts of Ukrainian e-commerce stores managed by ADWService, a Google Premier Partner agency. All data is anonymized at the aggregation level, with no possibility of identifying individual advertisers.
Period
The study compares two rolling 12-month periods:
- Last12 — May 2025 to April 2026 (current)
- Prev12 — May 2024 to April 2025 (prior)
This is a rolling comparison on a 24-month window, current as of May 2026.
Currency
All figures are reported in Ukrainian hryvnia (₴) with US dollar equivalents. Because the hryvnia depreciated against the dollar between the two periods, this report uses period-specific average official NBU rates: ₴40.7 = $1 for Prev12 (May 2024 – April 2025) and ₴42.3 = $1 for Last12 (May 2025 – April 2026). Year-over-year changes are shown in both currencies where the depreciation gap is material — UAH growth consistently runs about 4–6 points higher than USD growth, reflecting currency depreciation rather than real value change.
Metrics defined
- ROAS (Return on Ad Spend) is revenue divided by ad spend. A value of 8.19x means every ₴1 ($0.024) spent on advertising returns ₴8.19 in revenue.
- AOV (Average Order Value) is total revenue divided by number of orders.
- CVR (Conversion Rate) is the percentage of clicks that convert into orders.
- CPC (Cost Per Click) is the average price of one click.
Anonymization threshold
Every data cell in this study includes a minimum of 5 advertising accounts. Categories with smaller samples are excluded from the main tables.
What this study does NOT include
- Auction Insights competitive data — to be covered in the next edition
- Specific brands, product names, or competitor domains — withheld to protect advertiser anonymity
Section 1. Headline Metrics: What Changed in a Year
How much does Ukrainian e-commerce earn through Google Ads?
Over 12 months (May 2025 – April 2026), the e-commerce accounts selected for analysis (hereafter “tracked accounts”) generated ₴102.9M (298K). This produces an aggregate ROAS of 8.19x.
Note: the research sample does not cover ADWService’s entire client portfolio and does not represent all market segments. It is built from accounts that had complete 24-month data with correctly configured conversion tracking, providing a clean analytical base for conclusions about Ukrainian e-commerce trends.
In the prior 12-month period (May 2024 – April 2025), the same advertisers generated ₴94.0M ($2.31M) in revenue on ₴13.7M in spend, at a ROAS of 6.86x.
How key metrics changed
Metric | 2024–25 | 2025–26 | YoY (UAH) | YoY (USD) |
|---|---|---|---|---|
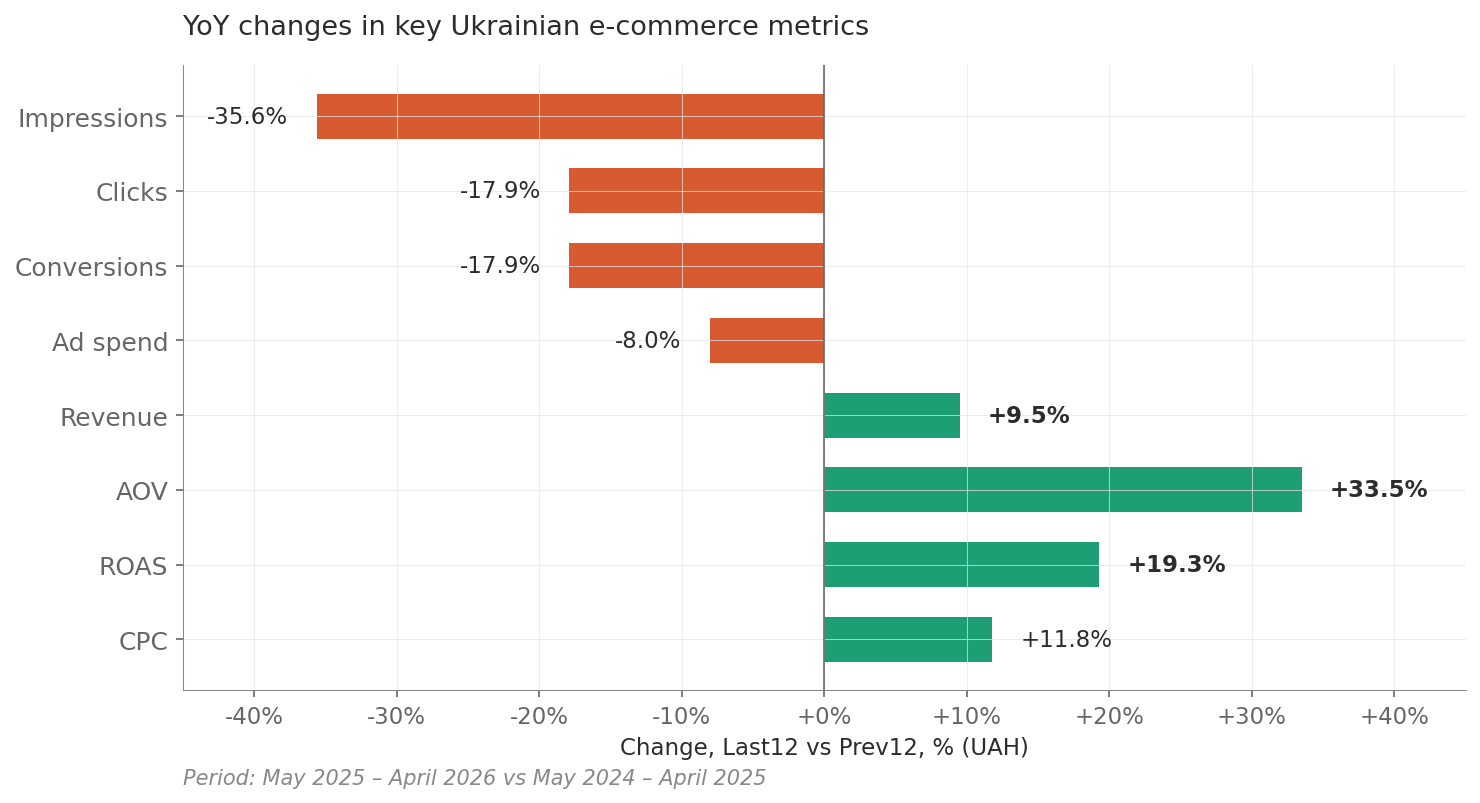
Impressions | 183,054,581 | 117,860,705 | −35.6% | — |
Clicks | 2,253,468 | 1,850,302 | −17.9% | — |
Conversions | 83,779 | 68,773 | −17.9% | — |
Revenue | ₴94.0M ($2.31M) | ₴102.9M ($2.43M) | +9.5% | +5.3% |
Ad spend | ₴13.7M ($337K) | ₴12.6M ($298K) | −8.0% | −11.5% |
ROAS | 6.86x | 8.19x | +19.3% | +19.3% |
AOV | ₴1,121 ($28) | ₴1,497 ($35) | +33.5% | +28.5% |
CVR | 3.72% | 3.72% | stable | stable |
Avg CPC | ₴6.08 ($0.15) | ₴6.80 ($0.16) | +11.8% | +7.6% |
Note: ROAS and CVR are ratios, so they are currency-neutral. Volume metrics (impressions, clicks, conversions) are unit counts. For value metrics (revenue, AOV, CPC), the USD growth is lower than UAH growth because the hryvnia depreciated ~4% between periods.
The core market paradox
Between Prev12 and Last12, Ukrainian e-commerce went through an unusual transformation: impressions fell 35.6%, clicks fell 17.9%, conversions fell 17.9% — yet revenue rose 9.5%. The market experienced a contraction in traffic but growth in revenue, driven by a 33.4% rise in average order value.
What it means at the typical-store level
Aggregate market figures hide significant variation between stores. The median Ukrainian e-commerce store in Google Shopping/PMax for 2025–26:
- Median AOV is ₴1,645 (25), upper quartile ₴2,670 ($63)
- Median ROAS is 6.12x — lower quartile 3.99x, upper quartile 8.34x
- Median CVR is 2.70% — lower quartile 1.62%, upper quartile 4.32%
- Median CPC is ₴7.75 ($0.18) — lower quartile ₴5.17, upper quartile ₴9.93
The spread between stores within a single market remains significant: the top ROAS quartile is double the bottom quartile.
Why ROAS rose despite falling conversions
The 19% ROAS increase came from a combination of two factors: a 33% rise in average order value (the result of active work on product feeds, campaign bucket structure, and targeting toward higher-value products), and an 8.2% spend reduction alongside 9.5% revenue growth (the result of reallocating budget to more efficient campaigns and categories).
A 33% AOV increase with stable CVR and official inflation of 10–12% signals a change in consumer behavior, not merely price increases. Ukrainian shoppers in 2025–26 are deliberately choosing more expensive products and buying less often — and the role of professional Google Ads management was to capture that shift: reallocate budget in time, update campaign structure for the new consumer pattern, and hold CVR steady despite falling traffic.
What happened to traffic?
Clicks on Ukrainian e-commerce stores in Google Shopping/PMax fell from 2.25M in 2024–25 to 1.85M in 2025–26 — a 17.9% YoY decline. Impressions fell even harder — 35.6% YoY (from 183M to 117.9M).
Impressions falling twice as fast as clicks means advertisers are getting more clicks per impression: CTR rose from 1.23% to 1.57% (+27%). Higher-quality traffic, but less of it. The Ukrainian e-commerce auction shrank in volume but became more precise.
How these figures compare to the broader Ukrainian market
According to UNN, Ukraine’s total online retail turnover in 2025 was ₴256B (+7% YoY). ECDB reports Ukraine’s total online revenue at $4.86B.
Revenue across ADWService’s tracked accounts grew 9.5% YoY — 35% faster than the market average. Stores with professional Google Ads management outpace the broader Ukrainian e-commerce market.
Section 2. A Mobile-First Market: 90% of E-commerce Traffic Comes From Phones
What share of Ukrainian e-commerce is mobile?
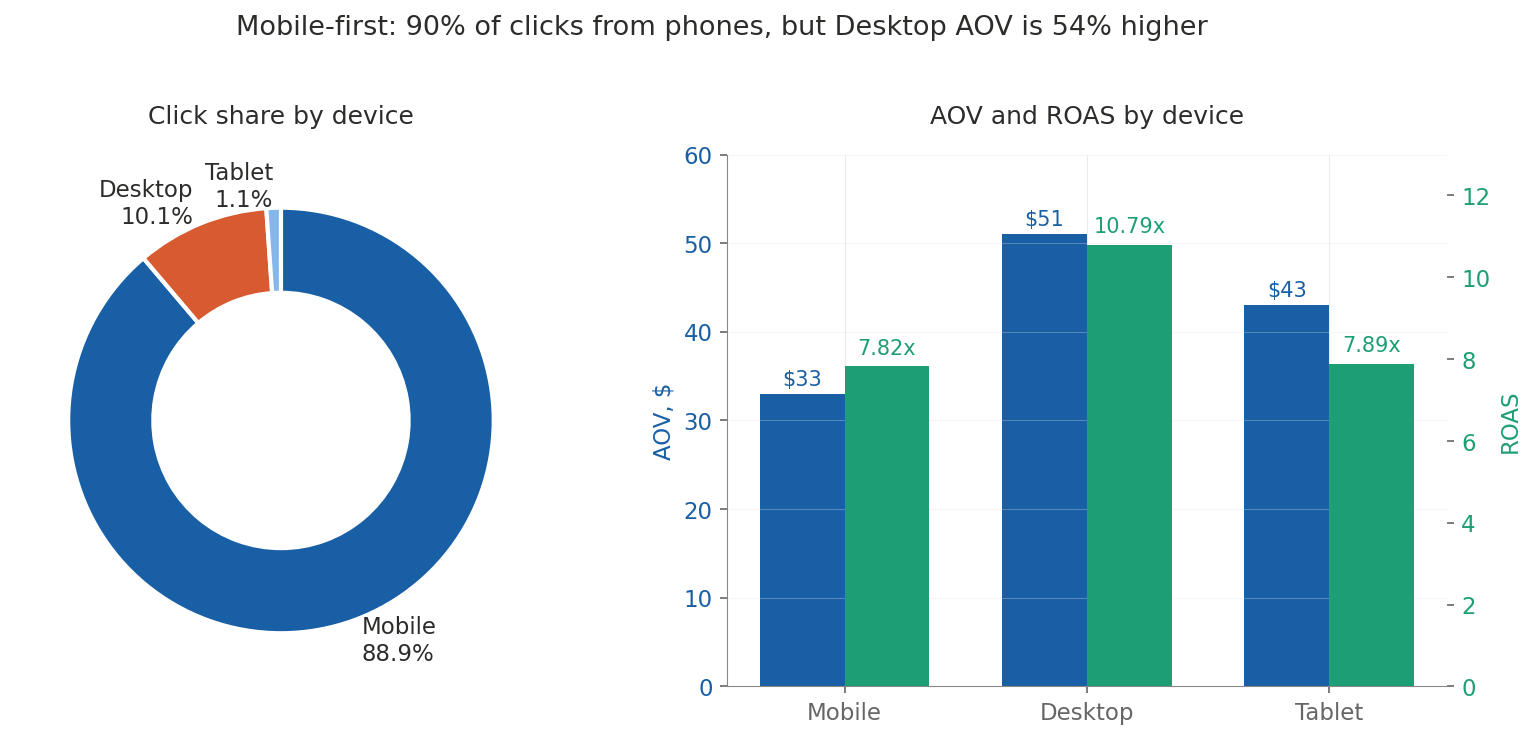
Per ADWService, in 2025–26 89.9% of clicks in Google Shopping/PMax advertising for Ukrainian online stores came from smartphones and tablets. Desktop advertising accounts for only 10.1% of clicks.
Device breakdown in 2025–26
Device | Click share | Conversion share | Revenue share | AOV | ROAS |
|---|---|---|---|---|---|
Mobile | 88.9% | 88.3% | 83.2% | ₴1,410 ($33) | 7.82x |
Desktop | 10.1% | 11.2% | 16.2% | ₴2,165 ($51) | 10.79x |
Tablet | 1.1% | 0.4% | 0.5% | ₴1,801 ($43) | 7.89x |
Why desktop still matters despite its small share
Desktop delivers only 10% of clicks, but its average order value (₴2,165 / $51) is 54% higher than mobile (₴1,410 / $33). Desktop ROAS is 10.79x versus 7.82x on mobile.
The interpretation for e-commerce stores: desktop is used for expensive, carefully considered purchases; mobile for impulse and routine buys. If your product page looks poor on a smartphone, you lose 9 out of 10 potential buyers in the Google Shopping/PMax channel.
Section 3. Channel Mix: PMax Dominance, Shopping’s Return, and the Rise of Demand Gen
How do Ukrainian e-commerce stores split budget across campaign types?
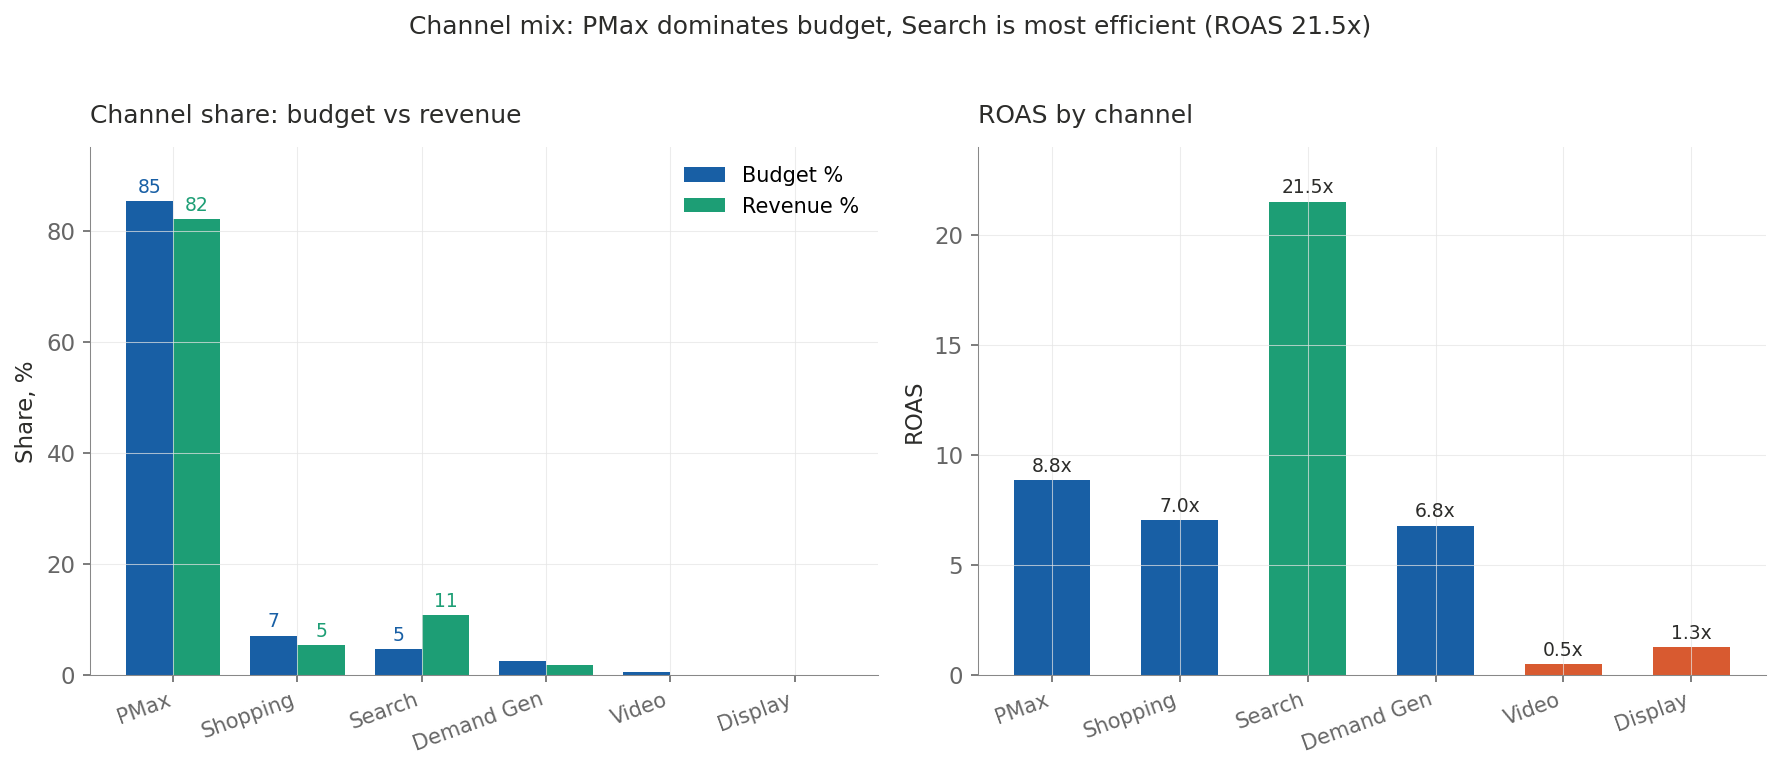
Per ADWService, in 2025–26 85.4% of the advertising budget of Ukrainian e-commerce stores went to Performance Max. The rest: Shopping 7.1%, Search 4.6%, Demand Gen 2.4%, Video 0.5%, Display 0.04%.
Which channel is most efficient?
Search has the highest ROAS — 21.52x in 2025–26 (up from 17.72x the prior year). That is 2.4x higher than PMax (8.85x). Yet Search occupies only 4.6% of budget while generating 10.73% of revenue.
ROAS by channel in 2025–26:
- Search: 21.52x — highest, driven mostly by branded and high-intent traffic
- PMax: 8.85x — the primary workhorse channel
- Shopping: 7.02x — stable, provides control over the product feed
- Demand Gen: 6.78x — a new channel rapidly gaining efficiency
- Display: 1.26x and Video: 0.47x — low efficiency, barely used
Search is the most underrated channel in Ukrainian e-commerce. It returns ₴21.52 per ₴1 spent, yet stores allocate only 4.6% of budget to it.
How did the channel mix change over 24 months?
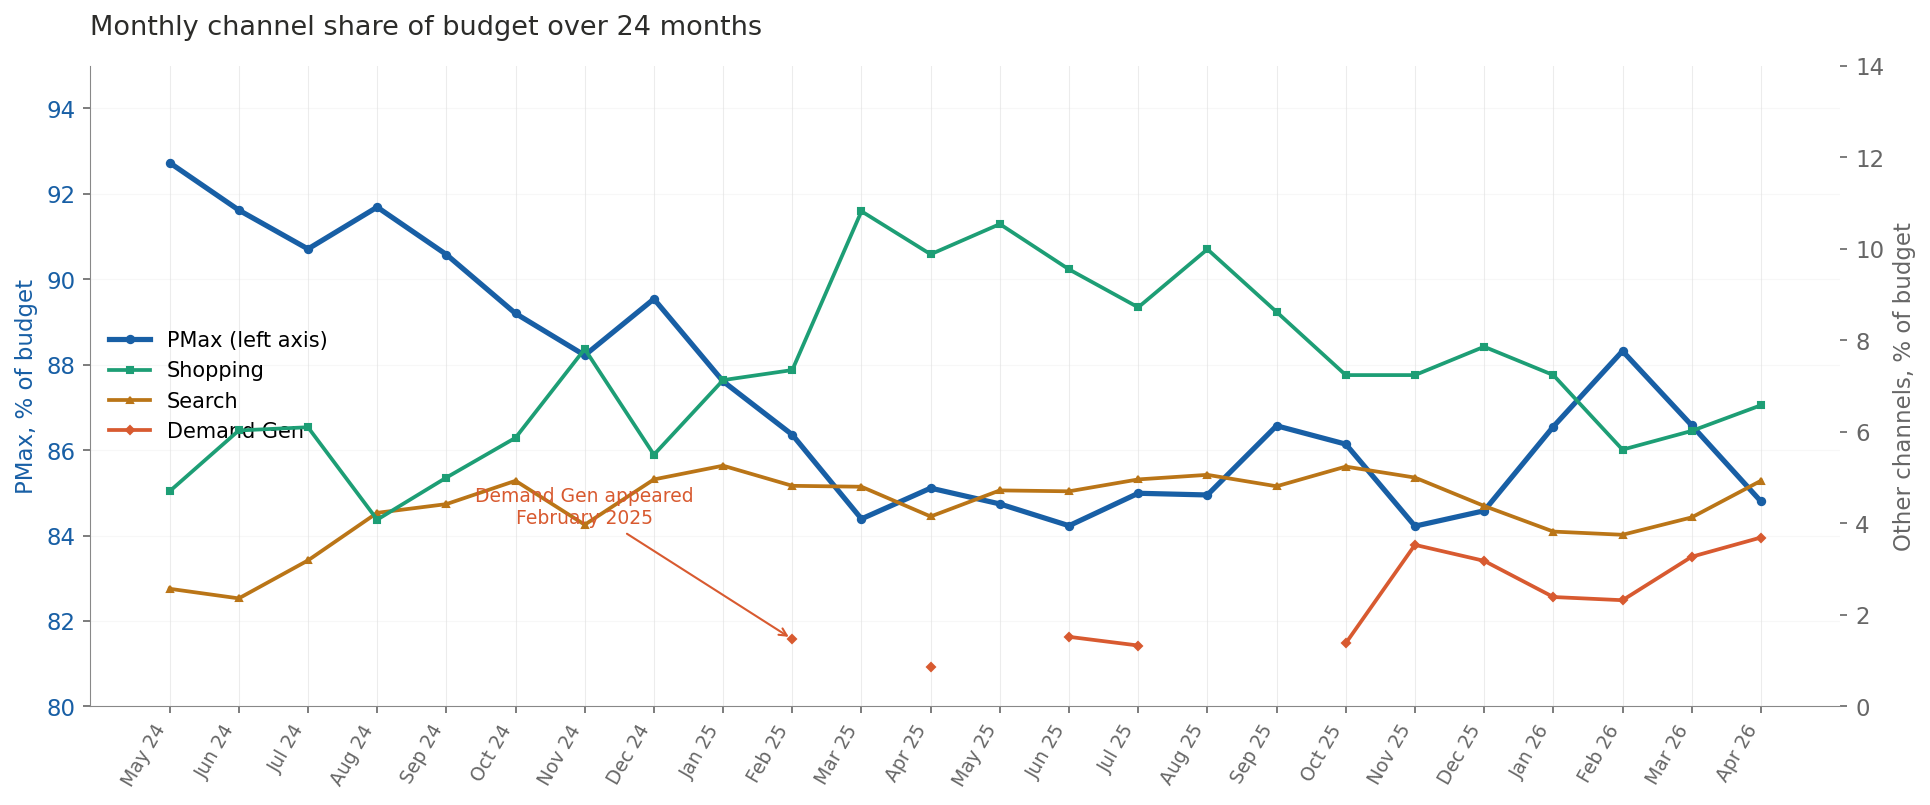
The monthly dynamics reveal three trends:
- PMax has plateaued and is gradually declining. PMax’s budget share fell from 92.7% (May 2024) to 84.8% (April 2026) — down 8 percentage points. PMax is no longer expanding its dominance; the market has reached saturation with this campaign type.
- Shopping returned in spring 2025. Until February 2025, Shopping held 4–7% share. In March 2025 it jumped to 10.8% and held at 8–10% through the second half of 2025. This signals the spread of a “PMax + standalone Shopping campaigns” strategy, where advertisers bring back Shopping for control over the product feed that PMax hides.
- Demand Gen appeared in February 2025. Before that the channel was absent from budget. Its ROAS grew from 3.51x (2024–25) to 6.78x (2025–26) — the channel “learned” in a year.
Takeaways for store owners
Check your Search budget share — if it is below 5% while Search ROAS exceeds PMax, you are underinvesting in your most efficient channel. Consider standalone Shopping campaigns alongside PMax — the market has been moving this way since spring 2025. Test Demand Gen if you are not yet — the channel has matured. Avoid pure Display and Video for direct sales — their ROAS is below 2x.
Section 4. Metric Dynamics: How CPC, AOV, and CVR Moved Across 24 Months
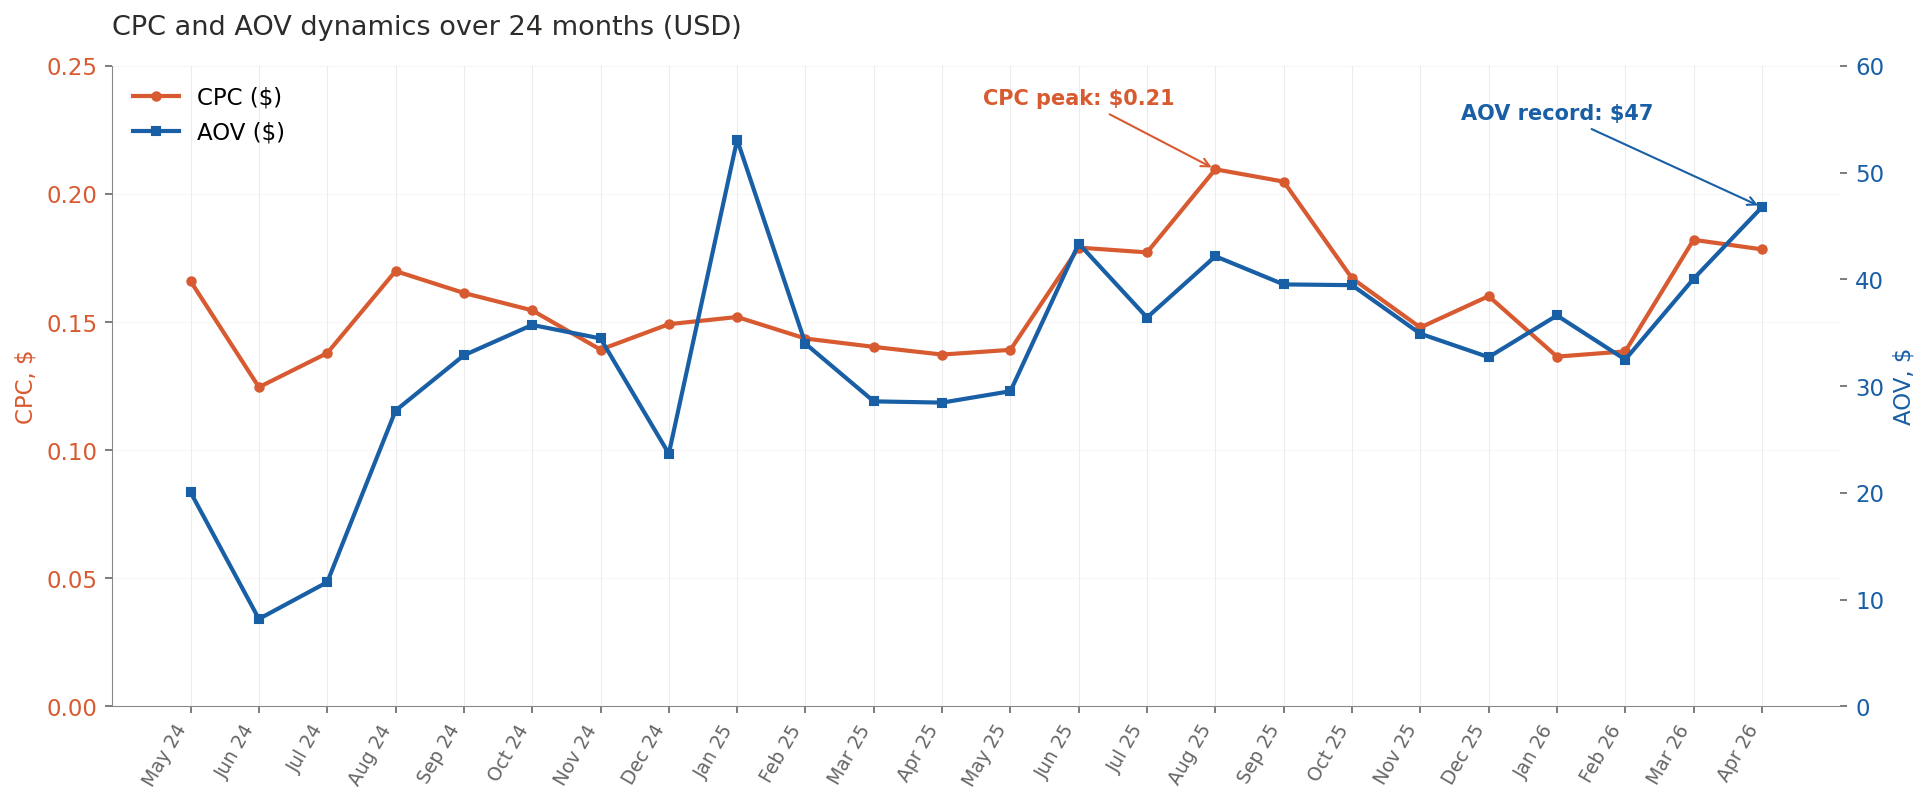
How did cost per click change?
CPC in Google Shopping/PMax for Ukrainian e-commerce rose 33% over 24 months — from ₴6.67 (0.18) in April 2026. The increase is non-linear with clear seasonality.
Two CPC peaks stand out: summer 2025 (June–September), with CPC from ₴7.43 to ₴8.74 ($0.21) — the highest in 24 months; and spring 2026 (March–April). The cheapest periods for advertisers were November 2024 (₴5.68) and January 2026 (₴5.76) — right after Black Friday and New Year peaks, when some advertisers temporarily exit the auction.
How did average order value change?
AOV rose from ₴806 (47) in April 2026 — a 147% increase over 24 months. Unlike CPC, AOV growth is continuous and structural, not seasonal.
The 2025 calendar year in detail: January 2025 peaked at ₴2,176 (deferred post-holiday demand, expensive purchases); February–April 2025 dipped to ₴1,175–1,396; summer 2025 brought a new wave of growth to ₴1,514–1,799; autumn 2025 plateaued at ₴1,466–1,653; December 2025 unexpectedly dipped to ₴1,377 despite record sales volume. The full-2025 average AOV was ₴1,508 ($36).
The record AOV came in April 2026 — ₴1,987 ($47), approaching the ₴2,000 mark and signaling the “buy less, spend more” trend continues into 2026.
The December 2025 paradox: the largest month by sales volume (₴11.74M) showed a reduced AOV (₴1,377 versus the autumn average of ₴1,600). Interpretation: in December, price-sensitive shoppers who buy less throughout the year return to make purchases. Holidays democratize the market — and the average check temporarily drops.
How did conversion rate change?
CVR for Ukrainian e-commerce in Google Shopping/PMax remained stable across 24 months — in the 2.5–4.0% range. Aggregate CVR for the last 12 months was 3.72%, identical to the prior 12-month period (3.72%).
Seasonal CVR peaks: December 2024 (4.14%), December 2025 (3.94%), February 2026 (3.48%). Seasonal CVR troughs (the lowest-converting months across 24 months): October 2024 (2.38%, pre–Black Friday comparison shopping), June 2025 (2.53%), February 2025 (2.57%), January 2025 (2.60%).
The weakest months for conversion are October, January–February, and June. Stable CVR alongside rising AOV is the key factor: Ukrainian shoppers buy less often, spend more, and convert at the same rate — meaning AOV growth comes from behavioral change among remaining shoppers, not from losing customers.
Section 5. Categories: Where Ukrainian E-commerce Money Goes
Which e-commerce categories dominate by revenue?
For the 12 months May 2025 – April 2026, the eight largest categories of Ukrainian e-commerce in Google Shopping/PMax:
Category | Revenue (₴M / $K) | AOV (₴ / $) | ROAS | CVR | CPC (₴) |
|---|---|---|---|---|---|
Electronics | 18.62M / $449K | 2,353 / $57 | 5.29x | 2.08% | 9.24 |
Electrical equipment | 13.14M / $317K | 2,720 / $66 | 13.29x | 2.00% | 4.09 |
Sports & recreation | 11.82M / $285K | 1,137 / $27 | 11.99x | 6.94% | 6.58 |
Pet supplies | 11.78M / $284K | 1,172 / $28 | 29.21x | 11.87% | 4.76 |
Kids & baby | 9.81M / $236K | 788 / $19 | 6.70x | 4.96% | 5.84 |
Repair & building materials | 8.77M / $211K | 3,536 / $85 | 7.55x | 2.17% | 10.17 |
Auto & moto | 6.28M / $151K | 2,074 / $50 | 5.57x | 1.72% | 6.40 |
Beauty & health | 5.64M / $136K | 677 / $16 | 7.73x | 6.83% | 5.98 |
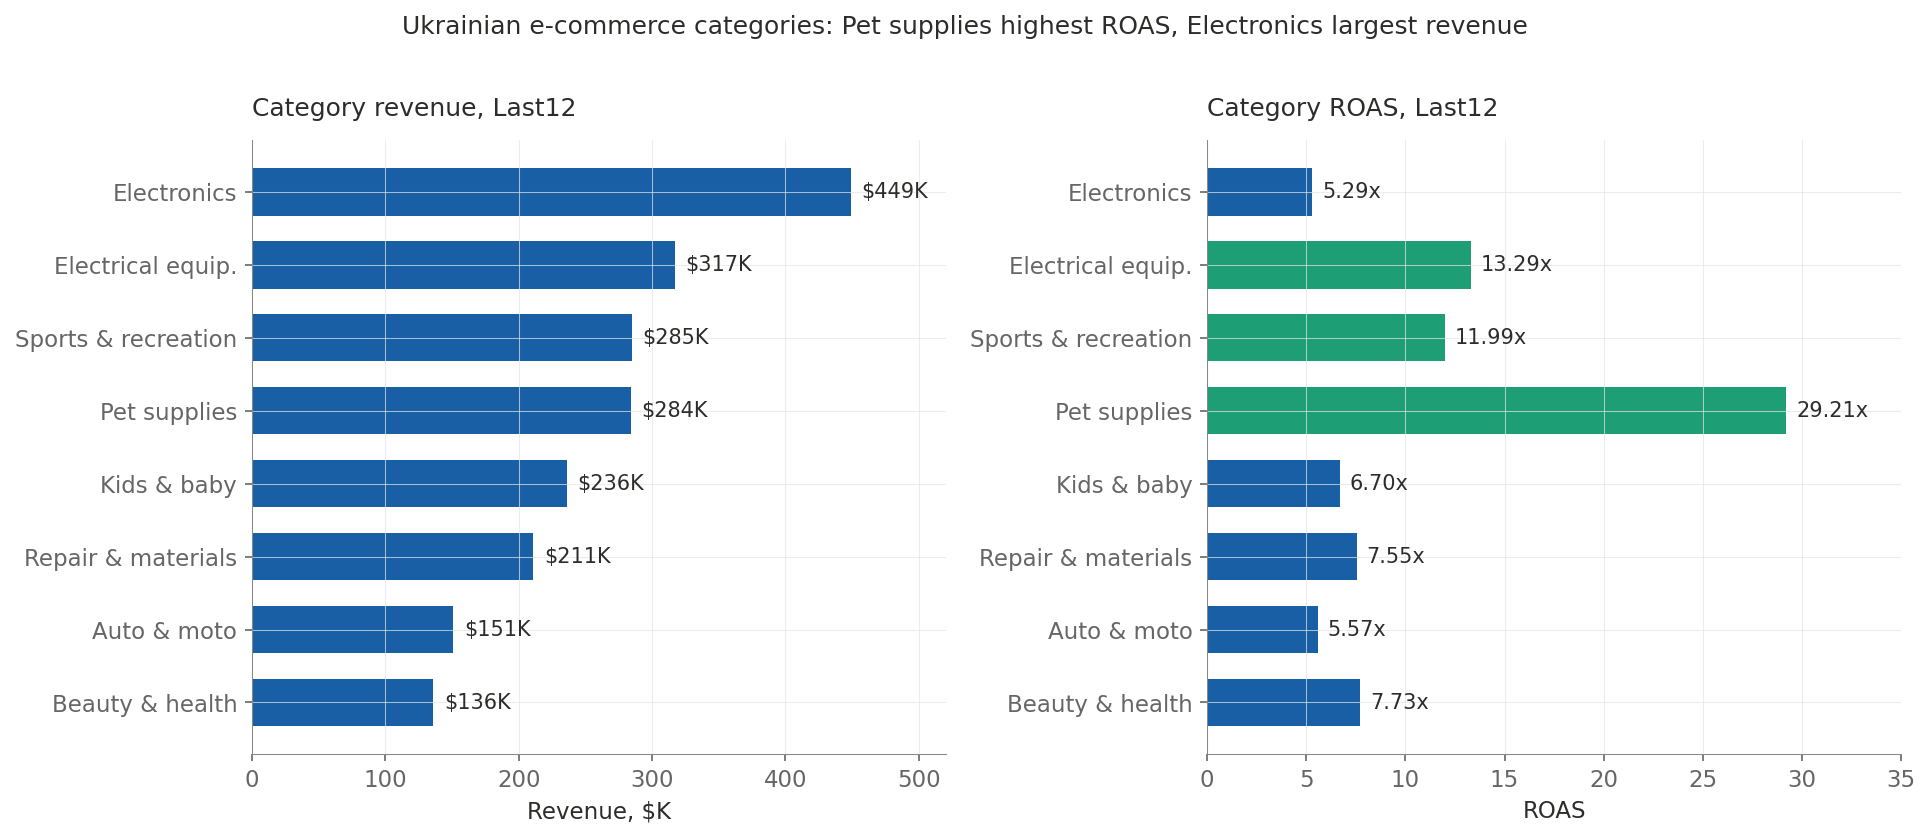
Electronics: the largest category by revenue
Electronics generated ₴18.62M (57), ROAS 5.29x, CVR 2.08%.
Year-over-year: revenue +8.6%, AOV +71.2% (from ₴1,374 to ₴2,353), conversions −36.6%, ROAS −7.0%. Electronics shows the market-wide trend in extreme form: a sharp drop in order count (−37%) offset by a steep rise in average check (+71%). Ukrainian electronics buyers in 2025–26 purchase less often but choose much more expensive models.
Electrical equipment: the quiet winner
Electrical equipment (generators, charging stations, inverters, power banks) generated ₴13.14M ($317K) in 2025–26 at a ROAS of 13.29x — one of the most profitable categories in Ukrainian e-commerce.
Year-over-year: revenue +80.6%, conversions +96.5%, AOV −8.1%, ROAS +40.1% (from 9.49x to 13.29x). The category grows on both volume and efficiency. This reflects sustained demand for backup power in Ukraine, with an auction that is not overheated.
Sports & recreation: a category to watch
Sports & recreation showed growth in 2025–26. However, the category sample is limited, and a significant share of the period-over-period delta is driven by individual stores that scaled most dramatically. ADWService flags this category as an area for further observation in the next benchmark edition. Last12 metrics: AOV ₴1,137 ($27), ROAS 11.99x, CVR 6.94%.
Kids & baby: steady growth
Kids & baby generated ₴9.81M (19) — one of the lowest AOVs in the market. Year-over-year: revenue +58.0%, AOV +27.9%, conversions +23.5%, ROAS +0.6%. The category grows from both more orders and higher prices, with roughly equal contributions.
Beauty & health: average check doubled
Beauty & health generated ₴5.64M (16) — the lowest AOV among top categories. Year-over-year: revenue +74.0%, AOV +61.2% (from ₴420 to ₴677), conversions +8.0%. Growth comes mostly from a rising average check: AOV up 61% with nearly flat order count. Ukrainian cosmetics buyers in 2025–26 are trading up to more expensive products.
Home & garden and Repair: the volume paradox
Home & garden generated ₴5.33M (85) is the highest among top categories. Both categories lost over half their orders but preserved revenue through higher AOV — a macroeconomic signal of deferred large projects amid uncertainty.
Auto & moto: stability
Auto & moto generated ₴6.28M ($151K) in 2025–26 at ROAS 5.57x — the smallest YoY changes of any category: revenue −10.8%, conversions −5.7%, AOV −5.4%, ROAS +7.7%.
Section 6. The B2B Segment: ROAS Twice as High as B2C
What the B2B segment of Ukrainian e-commerce shows
ADWService identified a distinct group of accounts serving the B2B segment — industrial equipment, medical equipment, trade tools, gas equipment, machine tools. These accounts show: median B2B ROAS 12.1x versus median B2C ROAS 6.0x — B2B is twice as efficient as B2C.
Characteristics of B2B accounts
Industrial and medical B2B accounts show high AOVs (from ₴3,000 to ₴50,000+ / $72 to $1,200+), low CVR (1.5–3.0%) due to long decision cycles, and stable seasonality with less dependence on holidays and sales events.
What this implies for agencies
Most marketing agencies in Ukraine work primarily with B2C. The B2B e-commerce segment remains less covered in public research, despite notable channel efficiency in our observations. ADWService flags this segment as a distinct area of study for agencies and researchers willing to specialize in industrial marketing.
Section 7. Seasonality of Ukrainian E-commerce: A 24-Month Curve
Which month is the peak for Ukrainian e-commerce?
Per ADWService, December 2025 was the single biggest month in the last 24 months of Ukrainian e-commerce in Google Shopping/PMax. Revenue hit ₴11.74M ($278K) — 2.2x the average month over the 24-month period (seasonality index 221).
The weakest month was May 2024 — ₴3.02M ($73K), index 57. The gap between peak and trough is 3.9x.
Monthly dynamics 2024–26 (₴M revenue)
Month | 2024–25 | 2025–26 | YoY |
|---|---|---|---|
May | 3.02 | 3.35 | +10.9% |
June | 4.32 | 4.34 | +0.4% |
July | 3.38 | 3.68 | +8.7% |
August | 3.09 | 4.32 | +39.9% |
September | 3.84 | 4.48 | +16.7% |
October | 4.24 | 5.84 | +37.9% |
November | 5.76 | 7.18 | +24.6% |
December | 7.65 | 11.74 | +53.5% |
January | 8.96 | 6.43 | −28.3% |
February | 5.41 | 5.93 | +9.5% |
March | 5.48 | 7.55 | +37.8% |
April | 3.21 | 4.10 | +27.8% |
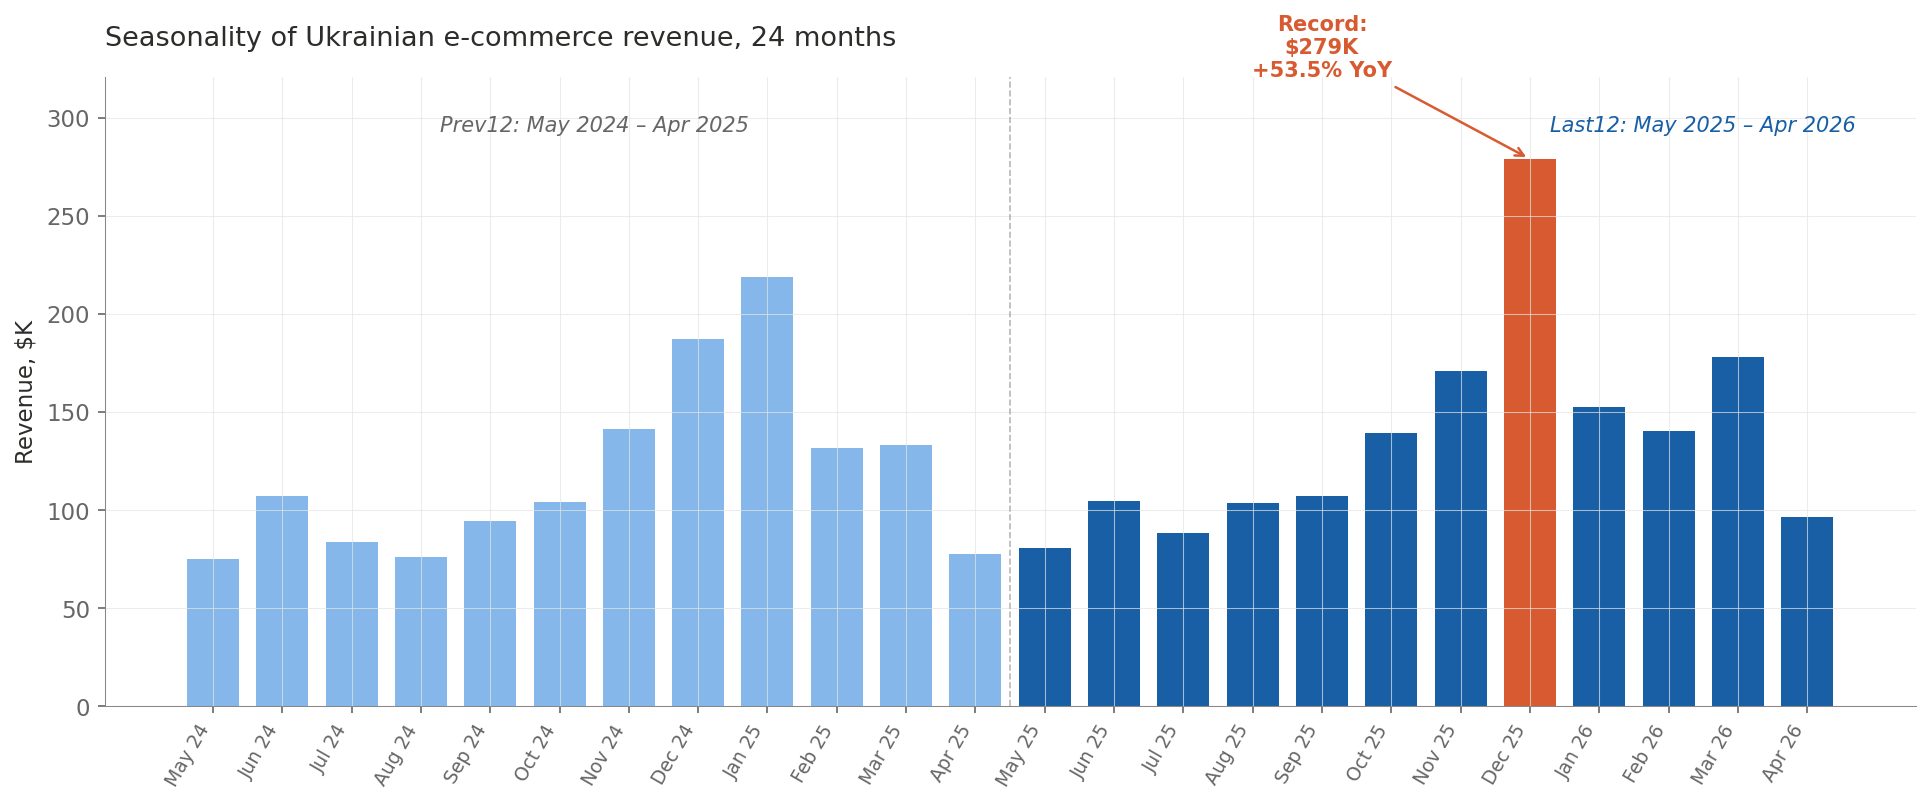
Black Friday versus December: a shifting trend
The December/November revenue ratio shows that Black Friday is fading as a driver: 2024 ratio was 1.33x; 2025 ratio was 1.64x. December 2025 (₴11.74M) was 53.5% above December 2024, while November 2025 (₴7.18M) was only 24.6% above November 2024. New Year holidays as a driver grow twice as fast as Black Friday. Ukrainian shoppers may be economizing on artificial Black Friday discounts and concentrating real purchases on New Year gifts.
Category seasonality
Each category has its own seasonal curve. Kids & baby explodes in December 2025 (index 487 — 4.9x the average month) for St. Nicholas Day and New Year gifts. Electrical equipment surges in December 2025 (index 473), tied to backup-power demand. Home & garden peaks in March (index 203) for the spring renovation and gardening season. Electronics has two peaks — December (index 244) and August (back-to-school prep).
The January paradox
January 2026 showed −28.3% YoY — the only month with a YoY decline. January 2025 was anomalously high (₴8.96M), explained by deferred post-holiday demand, with a predictable return to normal in January 2026 (₴6.43M).
Section 8. Where Demand Is Heading: Search Query Trends
What are Ukrainians searching for in 2025–26?
ADWService analyzed the search queries through which users find Ukrainian e-commerce ads, grouped into broad consumer categories, comparing query impression volume in Last12 versus Prev12.
Predictably, the top-growing queries are energy-independence products (power banks, generators, heaters, charging stations). This segment grew an average of 2,000% YoY and is well known to the market. To reveal less obvious shifts in consumer behavior, ADWService set the blackout category aside and analyzed the rest of demand separately. That is where the most interesting trends of the year appear.
Which consumer categories are growing fastest (excluding energy)?
Grouped by theme, search query impression growth YoY:
- Home, furniture, kitchen: +1,019% — furniture, kitchen appliances, tableware, textiles
- Health & self-care: +882% — massagers, recovery devices, orthopedics
- Kids & baby: +827% — toys, developmental products
- Watches & accessories: +722% — the largest category by absolute impression volume
- Sports, travel, recreation: +356% — travel goods, active leisure, home fitness
- Apparel, footwear, bags: +71% — steady growth in the base segment
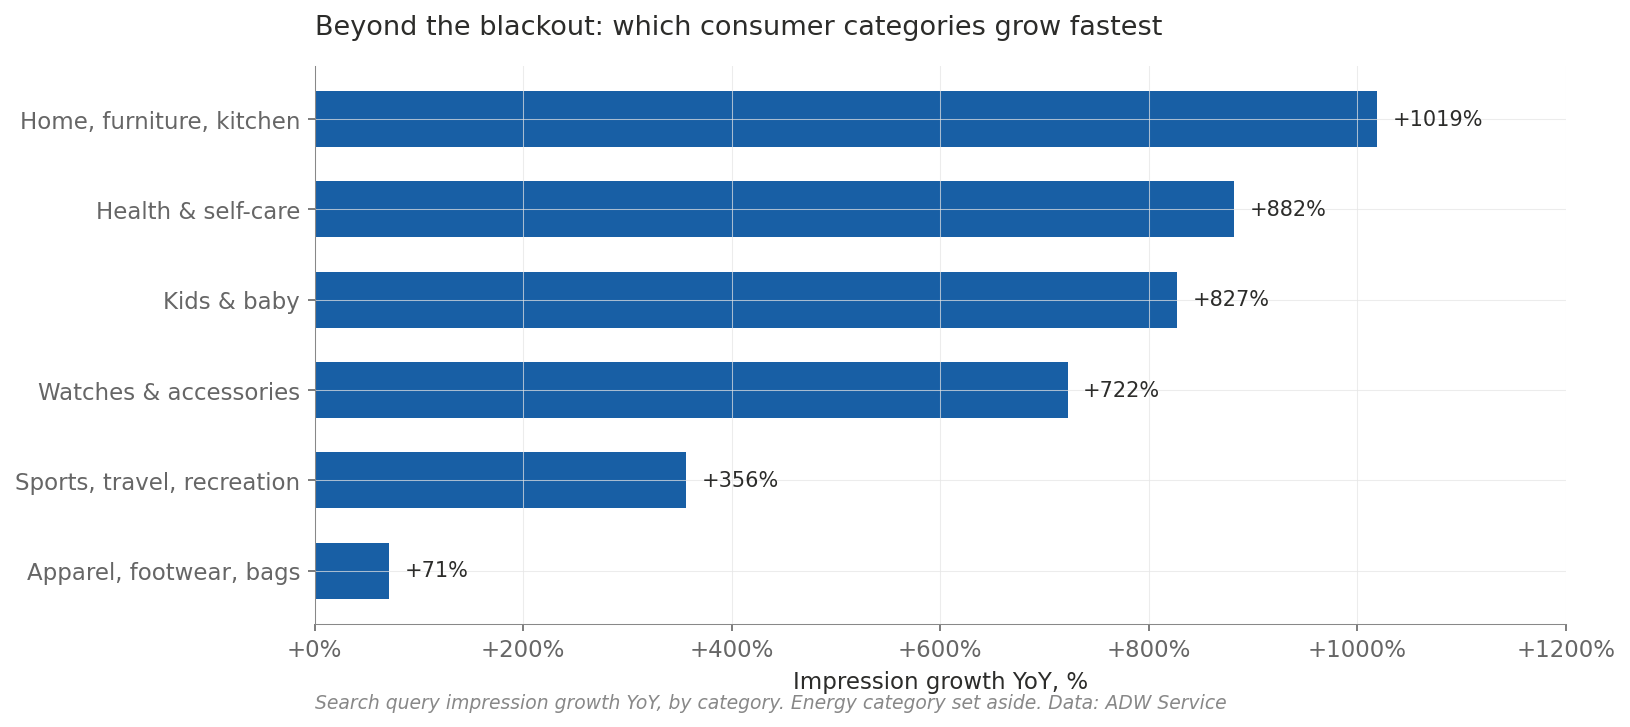
What it means
Setting aside the expected growth in energy products, the data reveals the key hidden trend: the Ukrainian consumer in 2025–26 is returning to normal, peacetime consumption. The fastest-growing categories are not survival goods but comfort, health, recreation, and home-improvement goods. “Home & furniture,” “Health,” “Sports & travel,” and “Kids” all grow by hundreds of percent.
This is a stronger signal of recovering consumer confidence than any macroeconomic statistic. Ukrainians are investing in comfort, health, and leisure — categories people buy when they look to the future, not merely survive the present.
Methodological note: for Performance Max campaigns, Google returns search queries in aggregated form (search themes). The analysis covers queries with a minimum of 5 advertising accounts and 100+ impressions, grouped into broad consumer categories. The blackout category (power banks, generators, heaters, charging stations) is excluded from the main analysis as expectedly dominant. Specific brands and product names are not disclosed to preserve advertiser anonymity.
Section 9. Conclusions and Forecasts
What 24 months revealed about Ukrainian e-commerce
- Ukrainian shoppers deliberately choose more expensive products and place fewer orders. AOV rose 33% with stable CVR and an 18% drop in conversions.
- Paid Google Shopping traffic in Ukraine is 90% mobile. Desktop-focused stores lose 9 of 10 potential customers.
- AOV growth is the market’s main driver in 2025–26. Without AOV growth, Ukrainian e-commerce would have shown an 18% revenue decline instead of 9.5% growth.
- Stores with professional Google Ads management grow 35% faster than the overall market. +9.5% YoY versus +7% per UNN — a structural advantage for those investing in proper setup.
- The B2B e-commerce segment is the most profitable, least competitive zone. ROAS twice as high as B2C.
- December is displacing Black Friday as the main sales month. The gap widened from 1.33x (2024) to 1.64x (2025).
What it means for Ukrainian e-commerce owners in 2026
Check your AOV in Q3 2026 — if it has not grown 25–35% YoY, you are lagging the market; consider premium-segment expansion, upselling, and bundles. Invest in mobile UX as priority #1 — desktop is 10% of clicks. Do not write off Black Friday, but do not rely on it — prepare December as the main event of the year. For categories with declining volume (Home, Repair, Auto), focus on AOV — falling conversions are offset by a higher check. For B2B stores, exploit the weak-competition advantage. If your ROAS is below 6.12x, you are in the bottom half of the market — that is the median for Ukrainian e-commerce in 2025–26.
What the market faces in H2 2026
ADWService’s forecast for the next six months: AOV will keep rising but more slowly (+10–15% YoY versus +33%); conversion counts will stabilize or return to growth; ROAS may decline 5–10% as the auction stabilizes; December 2026 will set a new monthly record; the B2B segment will start attracting more attention from large agencies.
What’s in the next benchmark edition
ADWService plans quarterly benchmark updates. The next edition (August 2026) will include: auction competition — a ranking of Rozetka, Prom, Epicentr, and niche leaders in the Google Shopping auction; Performance Max breakdown — how budget is distributed across Search/Shopping/Display within PMax campaigns; and a deeper analysis of regional demand differences within Ukraine.
About ADWService
ADWService is a Ukrainian Google Ads agency with Google Premier Partner status, ranked in the TOP-30 agencies of Ukraine per the Ringostat Rating 2025. The agency serves Ukrainian e-commerce stores, specializing in Shopping and Performance Max campaigns, the proprietary VELA product-classification methodology, and automated BigQuery + AI reporting.
Contact:
- Website: adwservice.com.ua
- YouTube: 1,400+ videos on Google Ads, 34,700+ subscribers
- Founder: Yana Liashenko, Google Ads AI Architect
Citation: Cite this research as: “Ukraine E-commerce Benchmark 2025–26: Google Ads Performance Report. ADWService, May 2026.”
Published May 2026. Next edition: August 2026. Currency conversions at average official NBU rates: ₴40.7 = $1 (Prev12, May 2024–April 2025) and ₴42.3 = $1 (Last12, May 2025–April 2026). © ADWService. Citation permitted with attribution to the source.