
Hi everyone. My name is Jana and I am a Google logistician. I am in charge of delivering targeted business audience with the required parameters.
Announcement of the advertising campaign that is discussed in the video
In today’s video, we’re going to be looking at the Lunar case study. Our market is the States. The topic is auto parts, we can put it there more. What can be pulled out in the first month and the difficulty of launching such niches.
Working with the project in the first month
I’ll tell you right away that it makes no sense to expect very cool results in the first month for those niches in which real optimization can last anywhere from 60 to 90 calendar days. Why is that so? Because Google itself delays the process of this optimization. We have to launch, get the first analytics, then check whether it is suitable or not, whether it fits into our KPIs or not. Then we have to do a shot at traffic. There’s usually two of them. One small, one a little bigger. A traffic shot is when we give a fairly significant increase in the amount of traffic and see if our conversion rate stays at the same level.
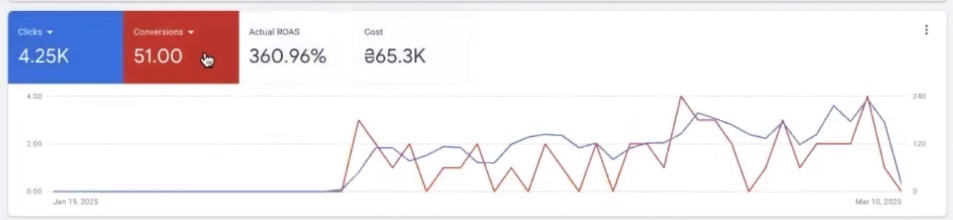
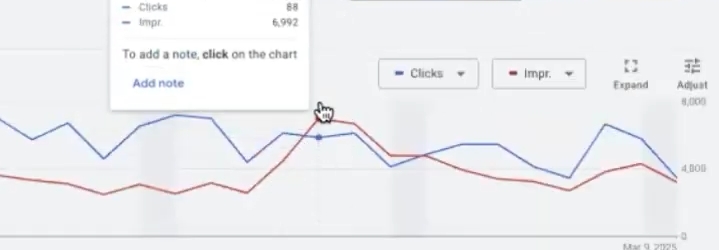
Let me show you, here we can also divide the month into two intervals. You can probably see where we had a shot. You can see a little bit of clicks here somewhere. I’ll explain everything now. We have conversions, so that no one thinks that I have made something up here, perches, that is, so that everything is fair. I will even reload the page, because there are guys here who draw cases, edit the code. Now Google’s going to load up and we’ll continue on. Let’s go to Overview.
Analyze the advertising campaign
What do we have? Launch. It took a very long time to get the advertising account up and running. Like the initial metrics were kind of straight up super really great if you see.
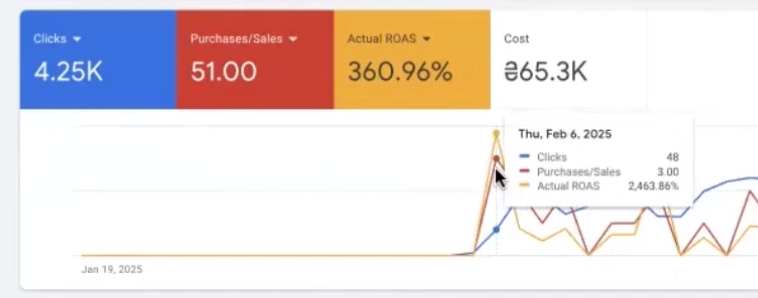
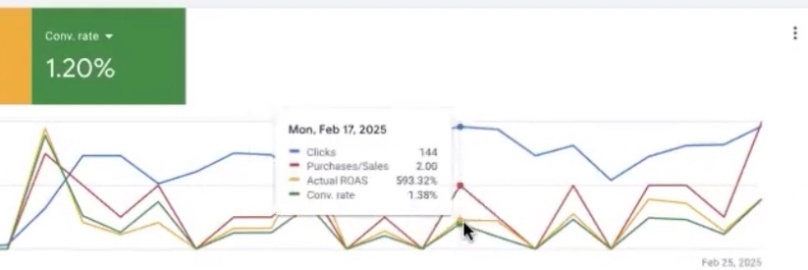
There’s ROAS 2463%, for example, there’s 1800%, there’s 593%, 715%, 1000%. That’s a pretty volatile story. We’re the one with the site on Shopify. On Shopify, it’s always some kind of certain instability.
Why? Because the conversion fixing is not going correctly enough because of the different sources of payment methods. For example, Shopify Payments, there’s always a problem with it on Shopify. And it’s a problem that affects the ad account directly. Why does it affect the advertising account additionally? Because if the automation does not get the appropriate feedback from the client, behavioral characteristics, then it will change targeting formats and you will have to force the automation to target according to the original source variant again.
We even had a pretty good format here, if you look at purchase here, ROAS, it was pretty good. We can even take this time period before our substantial shot attempt. Where do we have the first number here? February. Let’s make it 26 and up to 25 somewhere in February. That’s how we can look at it. Our overall profitability was a pretty good 565%. 27 conversions.
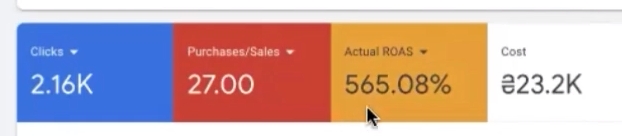
It was quite good in overall numbers, but not enough. For that volume of traffic, of course, and the first shot that was made here in the traffic, this period of time, it was made a little early, still the conversion rate was not that high.
Analyzing the Conversion rate
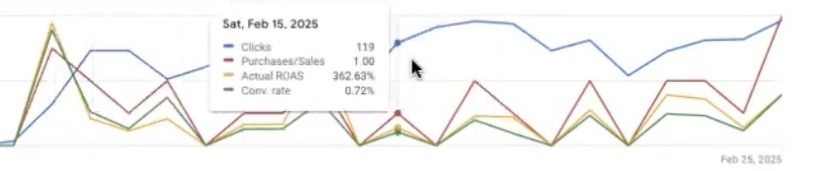
That is, if we go into conversion rate now, it is not that pretty enough. It is not maintained to the extent that it should be. 1.5% is usually the minimum plinth that it would be desirable to have in an advertising account. And the lower the conversion rate, it can be low enough there and under 0.3 and 0.6%, but that’s more typical for expensive niches. Furniture usually fits this, where the check is quite so high and there’s a very long cycle of making a purchase decision. For these niches it can be the norm – a low conversion rate. In our case, this conversion rate is on the edge. This is the period where we had our first mini-shot at traffic. Why are we doing a mini-challenge? To see if we can scale this set of conversion volumes to the conversion rate that we have.
We build a hypothesis that there is some conversion rate of our site and our traffic, directly on that analytics we try to make more of that same traffic. This is done in order to understand whether the AI-scheme has collected enough analytics to scale or not. There are a lot of niches in which it is worth it to get this analytics in a hurry, especially if it is ROAS-ing quite well. It is worth catching up on more statistics in order to understand whether they are statistically significant or not. That’s a nuance.
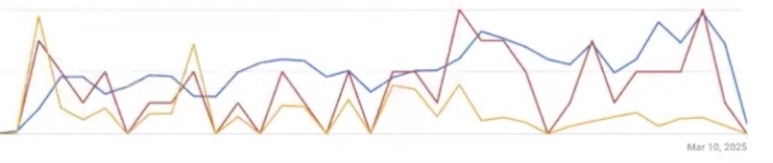
Well, you can’t see here that the conversion rate has held up. We got more traffic, primarily because more products went into the auction, went into shows. Most of it was unscrewed. Also, these conversion rate breakouts show us how tight or weak our bidding strategies are for this auction. This is also one of those important nuances. After this interval of time, our ROAS has gone down. You can see it over the last 7 days. Perhaps it will tighten up a bit, because after all, the conversions are late. Here you can see that on one more shot our ROAS dropped significantly.
We got 28 conversions. That’s not that many. You can even see that we only grew by 14 pts. And our profitability dropped by 200 points, but it’s good enough that at some point the conversion rate went up by 0.32%.
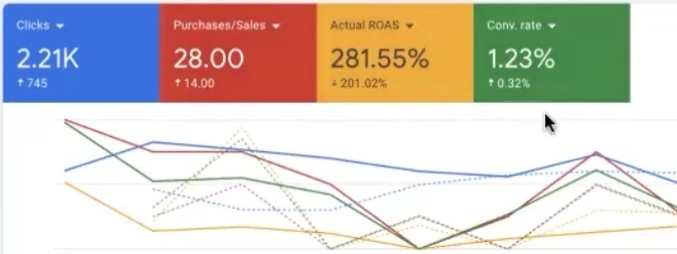
It’s not a super big number, but also the increase in conversion rate shows that the quality of traffic is pretty good. And most likely, with a very high probability, the profitability just this dropped because more products went into the auction.
Self-check the chosen strategy
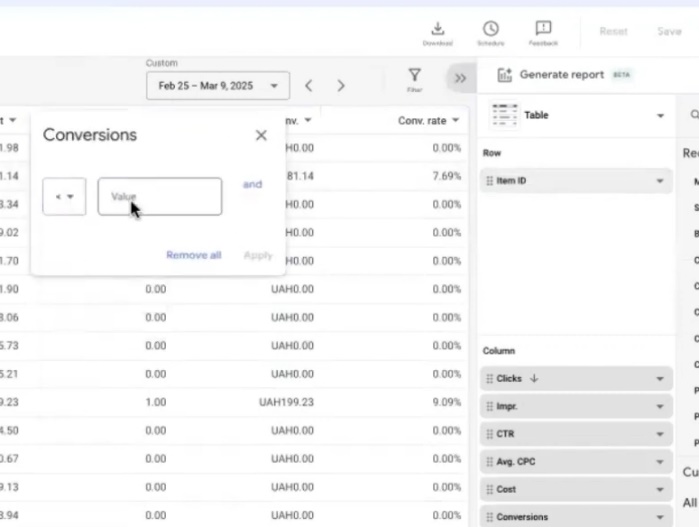
How can I check it? You can do it yourself in your accounts. Go into the shopping product report, take the same item IDs and take what situation? You can take conversions less than one. Just note that I have a “last click” attribution model, so I don’t have half conversions. You look at it your way. And we take costs more than 20 hryvnias. We take 20 UAH, so 300 goods at 20 UAH is also the amount of costs you incur. Not super critical in this context, but let it be.
Now let’s look, equalize the expense side. What can we see? It’s not going to be correct enough to equalize here. We’ll have to do it this way or make you two windows. Let’s fix it. 36,000 hryvnias. Right? Let’s take the time period. If we equalize, it’s the 12th to the 24th. Now it’s 12th to 24th. 6,000 hryvnias. In other words, our profitability actually fell not because Pmax did something wrong, something radically changed there globally. No, we simply made a fairly significant traffic cut. And this boost in traffic was primarily due to the fact that most of the goods went on display. If we take the fifth, second, ninth, for example, we can see that from the 25th we had a shot. For example, let’s equalize the 25th to the 4th. There will be no correct equalization here, because I am selecting a different set of conversions in different periods.
I’m about to show you two windows. Hold on. That’s the right thing to do. And what are we equating here? For example, here’s the 25th. Let’s go like this. 17th through the 24th. Right? Let’s take the last 14 days. Let’s say we pick the 25th through the 9th. What’s that? The 12th through the 24th. We take the 12th through the 24th in the first screen. That’s just to keep the number of days even. And here we have the 25th through the 9th. Let’s look, what do we see?
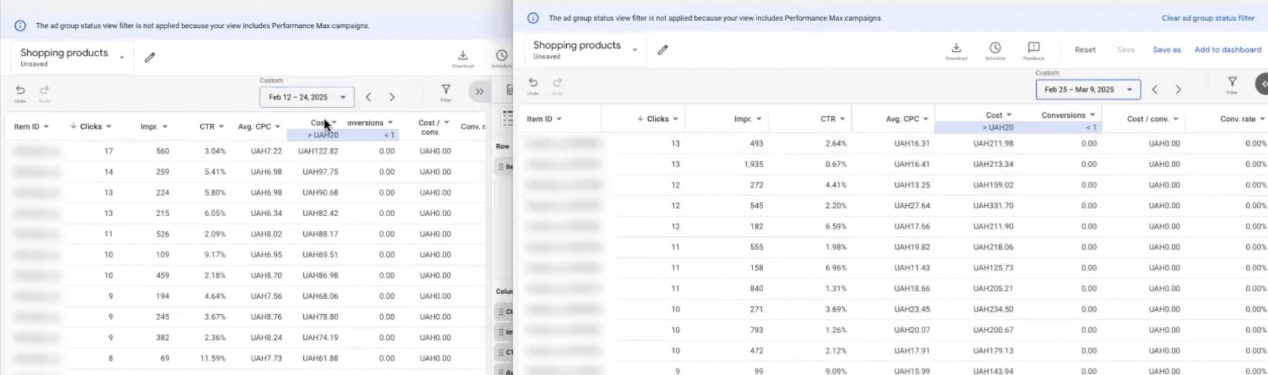
We see that in the period before we had expenses on goods only 7000 UAH, and now we have 36000 UAH. At the same time, are there goods that super drained traffic, somehow drained this money? No, there are some of the goods that made 331 UAH, 227. We can even see goods that made more than 20 UAH and less than 120 UAH. Let’s take a look in this period. There are 26000 UAH. That is, it is the main expense part. Or we could take the 50 grivnas. See? 1648 UAH. There are a lot of segments of goods that made some traffic and just on this shot we wanted to increase the number of conversions.
I think that maybe we were a little bit hasty, we would have liked to make this result faster, but as it is, as it is. The drop in profitability in this period of time is not due to the fact that the advertising account is very terrible or the mechanics of optimizing advertising campaigns went wrong somehow. No, it just turns out that in these overshoots we can immediately feel how over or under-compressed our bids are and how much product assortment can convert well or cannot convert well. For example, if you look even here, we have worked during this period, you can see by costas or by impresenes, so that you don’t think that I am hiding some campaigns here or something like that.
Parallel launch of two different advertising campaigns
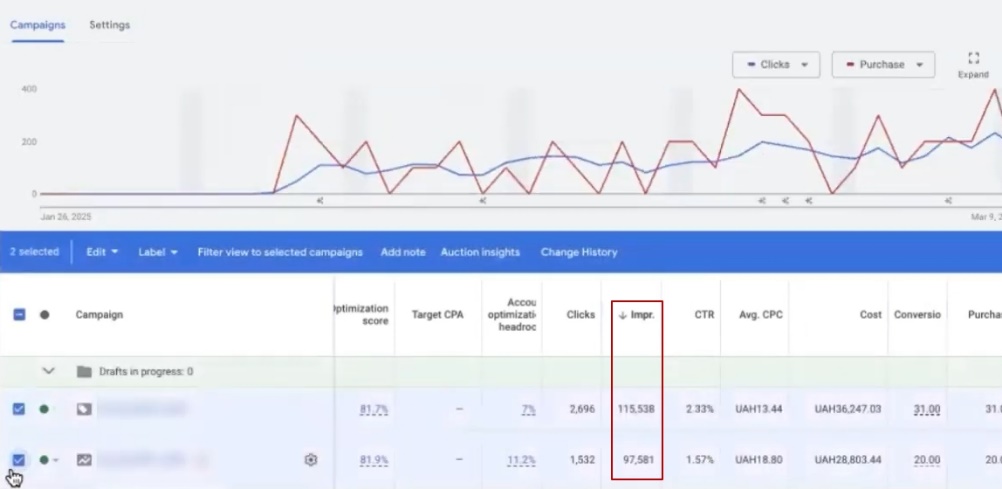
There are two advertising campaigns in total. One is a regular product campaign and the other is a Pmax campaign. We always run it this way in order to swing All items correctly. You don’t need a regular item to make Pmax work. And you don’t need Pmax for a regular commodity to work. The strategy options have just been set up differently here. What’s the purpose of this? In normal merchandising, we always overestimate profit margins. For what? To feel it. I mean, the profitability is higher here, you probably won’t see it on the video, but it’s twice as high as in Pmix. What’s the purpose of this?
First, to see if the account is ready from scratch. Here it was not exactly from scratch, but for the last 30 days there were no shows anywhere in particular, to generate a higher profitability than we need. Second, in Pmax, we purposely underestimate the profitability in order to be as competitive as possible in some aspect.
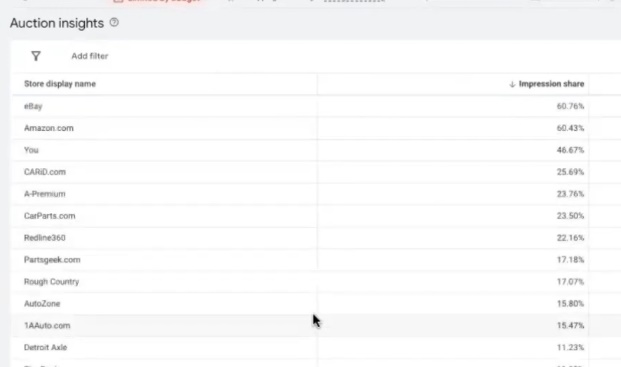
In each of these situations, we look at the auction statistics to see where we are, where we stand. We look in the competitors, we look at the indicators that we need. As you can see, in regular merchandise, we’re not even in the top at all during this period, which is super great, super awesome. These are variants of those tests that need to be done.
Are the same analytics available in Pmax? We can take a look now. Auction statistics. As you can see, there is no search here. It’s a Feed Only type of campaign. We also have a fairly low percentage.
This, by the way, is one of those situations that really clearly shows that it was a bit early, but why not test it, if before that we saw absolutely very good indicators in purchases. Moreover, you can see here, for example, on February 25, on the contrary, there were even more pieces. Yes, not all the period can be perfect, but the beauty of the flight, there is quite good, as it seems to me.
Change in the profitability index
Or did the whole period fit into profitability? No, I’ve already written about that. The reason is the drop in conversion rate on the background of traffic, and I even described to you the reason why profitability has dropped so much. You can see, there was a very good shot here, because there was good profitability here, a margin of safety.
And you can even see here in the shows that the shows have changed, although the clicks were kept in the main some block. You can see that the buys here really aren’t super stable. Unlike Pmax, you see, maybe that’s what I’m watching all the campaigns, right? Pmax has been really really slow to swing, slow to put together analytics, but there’s also nuances.
Conclusions on the results of the first month
All in all, I think the result is pretty good for the first month. I could have saved a little money. We could have waited for this whole period, but my hand itched. Two campaigns, they need to be monitored and controlled. It was too early to cut up the product range by all indicators. Just now there will be a perfect picture on the background of this breakthrough in traffic, in clicks to cut some of the goods. Cut back on what? To pick out those products that are super expensive. To pick out the products that have not converted at all. Goods that didn’t get any clicks at all. Allocate some stable kowtows that can work.
Already on this analytics is ready for the second month for optimization. It is clear which goods work better, which are worse, which profit margins to set. Basically, everything is as the book wrote, it could be even more, but on a larger, not so big shot here it can be seen. Still, not everything is so smooth. In these periods, our conversion rate swam a little. Somewhere it was really 1.70%, but 1.20%. Here’s 1.09%, 1.70%. It’s unstable. Not all product mix converts as well as you’d like.
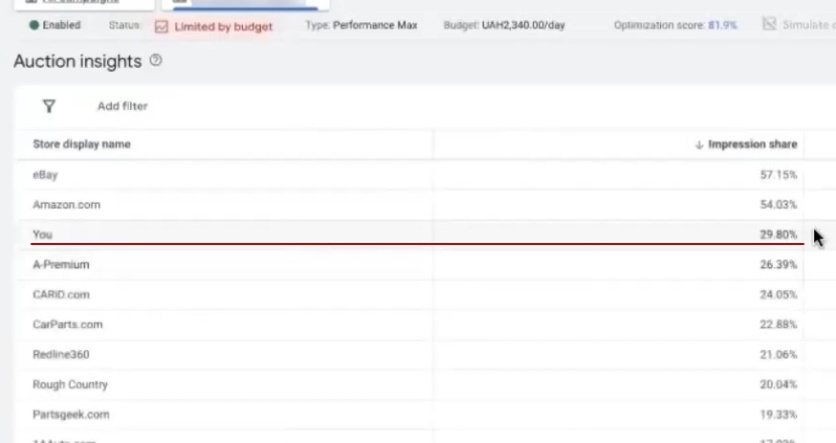
These are signals to you, the first one, that you can put up profit margins without shying away from the big ones. Yes, the auction statistics are more or less logical and justified at these low profit margins and at higher ones. I also saw in the auction statistics that there is potential for additional segmentation not only by check, by product range, by structure. Yes, our cash cows, dogs, stars, zeros.
You can still optimize something additional, because if super serious competitors like eBay, budget, large-scale, Amazon, come in, it means that there are niches in which you can be very good in both product segments and auction segments, I won’t say which one, you can very well shovel out your piece of the pie, even though there are some competitors who can come in quite inadequately.
Conclusion
It seems to me – not a bad case. Yes, here you will not have a super 1301 sale for 5$, here it is still a little more expensive in the context of the long-term, but had time to try even to shoot and try to test a larger set of goods in order to understand how well it can convert into pluses or minuses.
That’s the kind of mini case study on the States that I’d like to share with you. I don’t know if I may have hit some essential points or not for you. Some nuances, perhaps one case can be really long to sort out. Some technical moments, why it was launched in this way, why not otherwise, what products, why at this moment they decided to shoot through, why not in another, why, a regular product could not give conversions for the whole period, or they launched it first on manual. You can have a very long conversation. This is just a standard to show what has been done, why it is more expensive, why the period there was quite cool, why the period after became a little more expensive. To show how the team works. This data that you are seeing now is the result of thoughtful, systematic actions by the team, and not just a case of luck that somewhere we hit some traffic and were carried away by a wave. This is the case I wanted to share with you.