Performance Max promises, “Just give us a budget and a feed—the algorithm will do the rest.” In practice, it does, but not always in the direction the business needs. The budget drains on zero-margin bestsellers, half the sales come from people who were already searching for your brand, and the report shows a 600% ROAS on paper while the cash register shows a loss.
Performance Max ROAS depends not on Google’s magic, but on what data you feed the system and what you restrict it from doing. Below, we’ll break down how to increase ROAS in Google Performance Max step by step: from finding the cause of a drop to scaling a campaign that is already profitable. The examples are tailored for a Ukrainian online store, using hryvnias.
Why Did ROAS Drop in the Performance Max Campaign?
Before changing anything, figure out what broke. A typical mistake is seeing a drop, immediately lowering tROAS or replacing creatives, and two weeks later discovering a broken conversion tag.
The question “why did PMax ROAS drop” has five typical answers:
- Tracking broke. You updated the site, changed the theme, or migrated to another CMS, and the purchase event stopped passing value. There are sales, but the ads don’t see them.
- Merchant Center disapproved some products. The campaign lost its top items and is showing everything else.
- A sharp budget increase. A 50–100% jump all at once resets accumulated data, and the learning phase begins again.
- Competition or seasonality changed. In November, the CPC for home appliances jumps by 30–40%, and ROAS drops without a single edit in the account.
- The campaign expanded to brand queries or cheap products where there are many conversions but no margin.
Run your checks in this order: first, conversions in Google Ads and GA4 (do the numbers match over the last 7 days?), then Merchant Center diagnostics, and finally, the “Insights” tab and the channel performance report. The cause is usually found in the first two steps.
Tip: Before making any edits, record your baseline metrics for 30 days—ROAS, CPA, AOV (average order value), and the share of brand queries. Without a starting point, you can’t evaluate the impact of your changes.
How Can Conversion Setup Help Increase Performance Max ROAS?
The algorithm optimizes for what you feed it. If “add to cart” and “checkout” are both treated as conversions, the system will bring in people who add items to their cart and leave. Technically, there are many conversions, but revenue is zero.
To set up conversions for PMax, follow these principles:
- One primary action—purchases with passed value. Move all micro-conversions (cart, product view, subscription) to secondary. They will show up in statistics but won’t affect bidding.
- Pass conversion value dynamically—the actual order amount, not a flat 500 UAH. Better yet, pass the margin instead of revenue, if your CMS can calculate it. Then the campaign will optimize for profitability, not just turnover.
- Enable Enhanced Conversions. Due to cookie restrictions, some purchases get lost; this feature brings 10–20% of “missing” orders back into the reports, allowing the algorithm to learn from a more complete picture.
- Check that GA4 and Google Ads aren’t duplicating the same purchase. Two purchase events for one order will make the reported ROAS look twice as good as reality.
What Target ROAS Should You Set for Performance Max Optimization?
This is a frequently asked question, and the “400%, like everyone else” approach is harmful. Target Return on Ad Spend should be calculated based on your business margins.
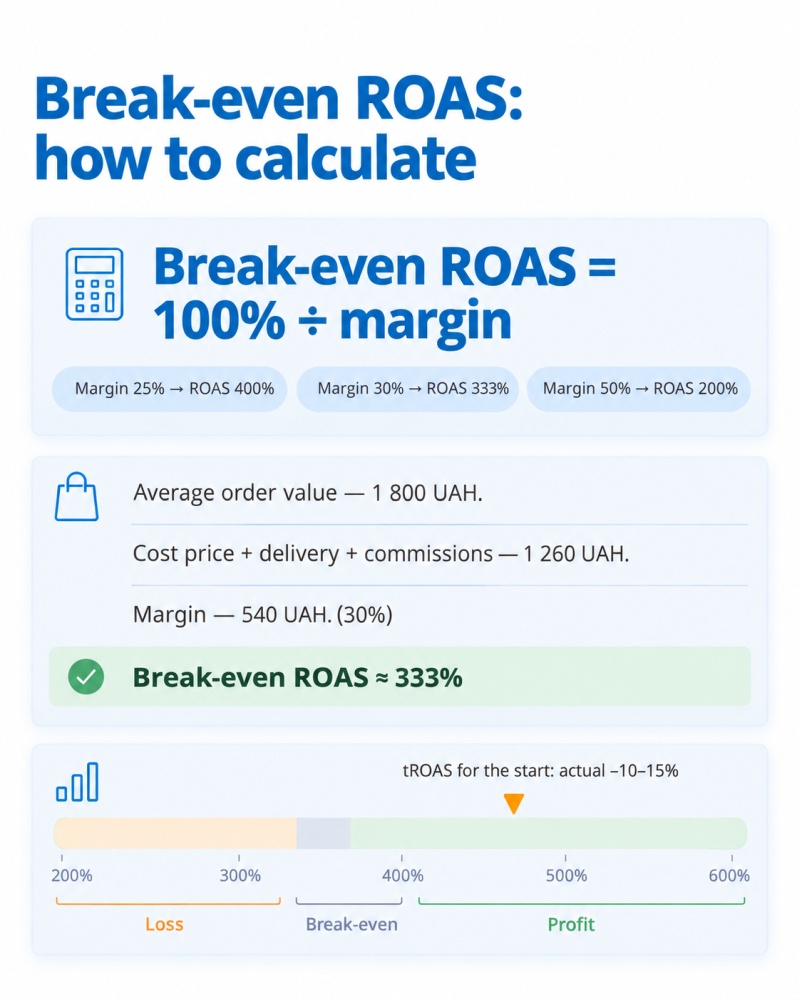
The minimum ROAS where ads break even equals 100% divided by the margin. A 25% margin means a breakeven ROAS of 400%. A 50% margin means 200%. Calculate it using your own numbers:
- average order value — 1,800 UAH;
- cost of goods sold, including delivery and fees — 1,260 UAH;
- margin — 540 UAH, or 30%;
- breakeven ROAS = 100 / 0.30 ≈ 333%.
A tROAS of 350% for this store means breaking even. To increase ROMI rather than just turnover, the target must be higher: 450–500%.
Important caveat: You shouldn’t punch 500% into the settings right away. Target ROAS acts as a restrictor: the higher the target, the fewer auctions the campaign wins. Set an overly aggressive tROAS at the start, and you’ll get no impressions.
The workflow to increase ROAS in Performance Max:
- Launch with “Maximize Conversion Value” without a target until you accumulate 30–50 purchases over 30 days.
- Look at the actual ROAS for the period. Let’s say it’s 380%.
- Set the tROAS 10–15% lower than the actual figure (in this case, 330–340%) so you don’t “choke” the campaign.
- Every two weeks, raise the target by 10–15% until conversion volume starts to drop. That is your working limit.
Attention! After every tROAS change, the campaign enters a learning phase—from 7 to 14 days. Evaluating the results on day three and tweaking the settings again is a surefire way to never exit the learning phase.
If your inventory contains products with both 15% and 60% margins, separate them into different campaigns with different tROAS targets. Otherwise, the algorithm will focus on the cheaper items: they convert more frequently, yielding a good ROAS but minuscule profit.
How Can Feed Optimization Help Improve PMax Campaign Performance?
For an online store, the feed is 70% of success. Shopping ads bring in the largest share of revenue, and they rely exclusively on feed data. Beautiful banners won’t save you if the product title says “SKU 4471-B blk.”
What to look at first when optimizing a feed for Performance Max:
- Titles. Brand + product type + key attribute + model. “Reebok men’s white sneakers size 10” will get found; “Reebok LX2200 wht” won’t. The first 70 characters are the most important: they are what make it into the ad.
- Images. A white background for the main photo, no watermarks, no “30% Off” text overlaid on the product. Google disapproves such images or shows them less often.
- Price and availability. Price discrepancies between the feed and the website are a direct path to suspension. Update the feed at least once a day, and multiple times for dynamic pricing.
- GTIN and Brand. Without these, a product might not enter certain auctions, especially for well-known manufacturers.
- Custom labels. Tag margins (high / mid / low), seasonality, and discount availability. You can easily build asset groups or campaigns around these labels later.
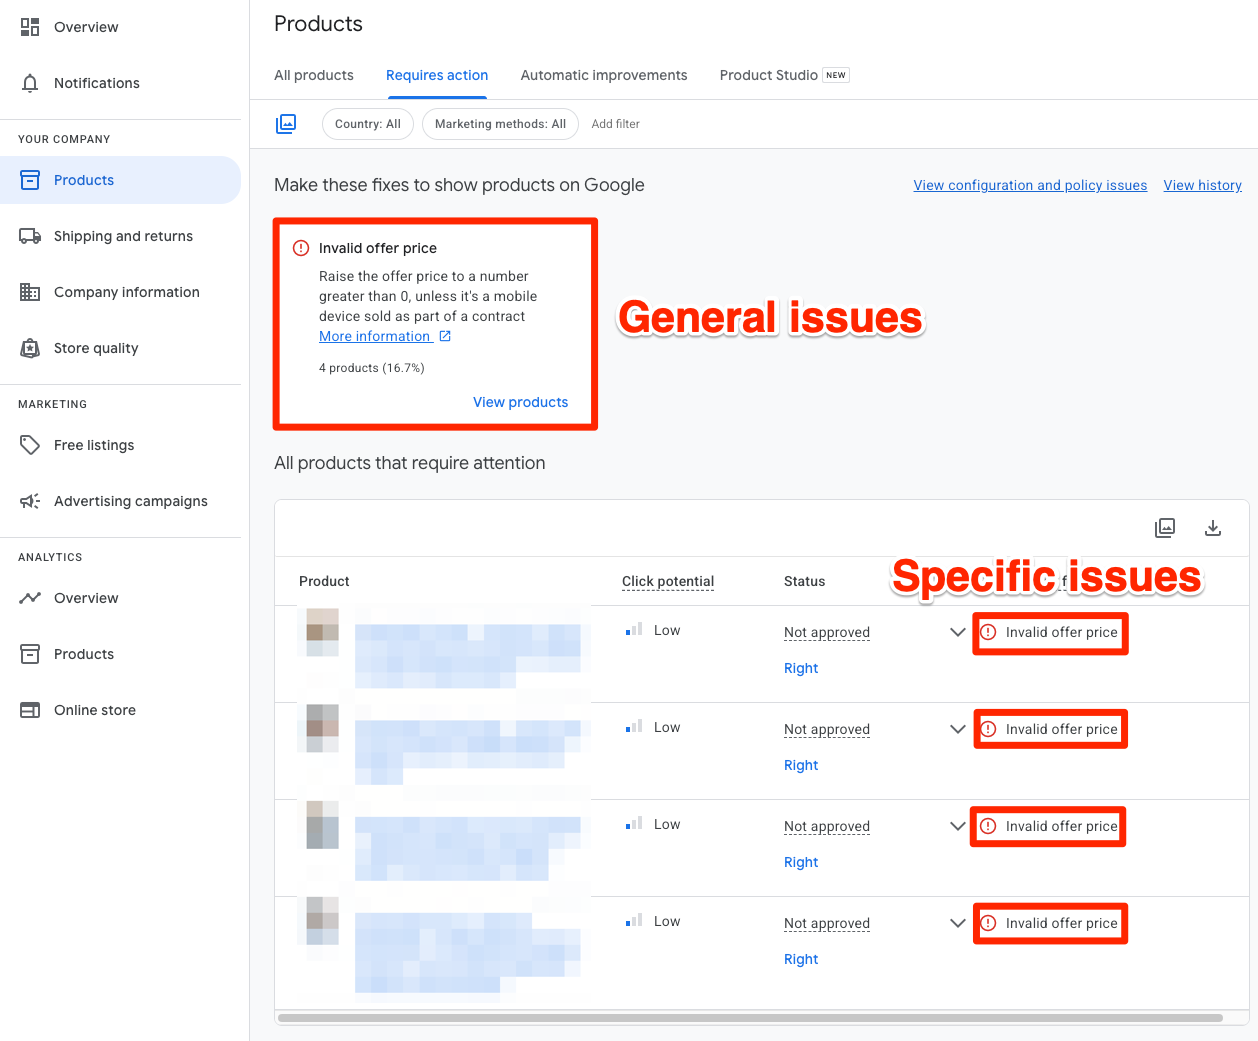
Tip! Feed optimization isn’t a one-time task. Once a week, open the “Diagnostics” tab in Merchant Center to see how many items are disapproved or restricted. When 15% of your inventory isn’t showing due to a “missing shipping attribute,” no tROAS tweaks will save you.
Bestsellers and “Zombie Products”: Where the Budget Actually Goes
Open the products report and sort by cost. The picture is always the same: 10–15% of the items eat up 80% of the budget, while hundreds of items get zero impressions. These are your bestsellers and “zombie products.”
Bestsellers, however, aren’t always the most profitable. PMax favors what sells well, not necessarily what makes you money. Meanwhile, it ignores items that haven’t had time to gather data.
What to do:
- Isolate products with high ROAS and high margins into a separate campaign with a more aggressive target—these are your scaling candidates.
- Exclude items with high spend and sub-breakeven ROAS from the campaign, or move them to a lower-priority group.
- Create a separate campaign for the “zombies” with a small budget (200–400 UAH per day) and a low tROAS, or use “Maximize Conversions.” Give them 3–4 weeks. The ones that start selling can be moved to the main campaign. Remove the rest from your ads and figure out the issue: price, photo, or title.
The reason “zombies” appear is usually trivial: the feed price is 15% higher than competitors in the Shopping results. The algorithm sees that you’re losing on price and won’t waste money on that item.
Brand Exclusions, Negative Keywords, and Placements
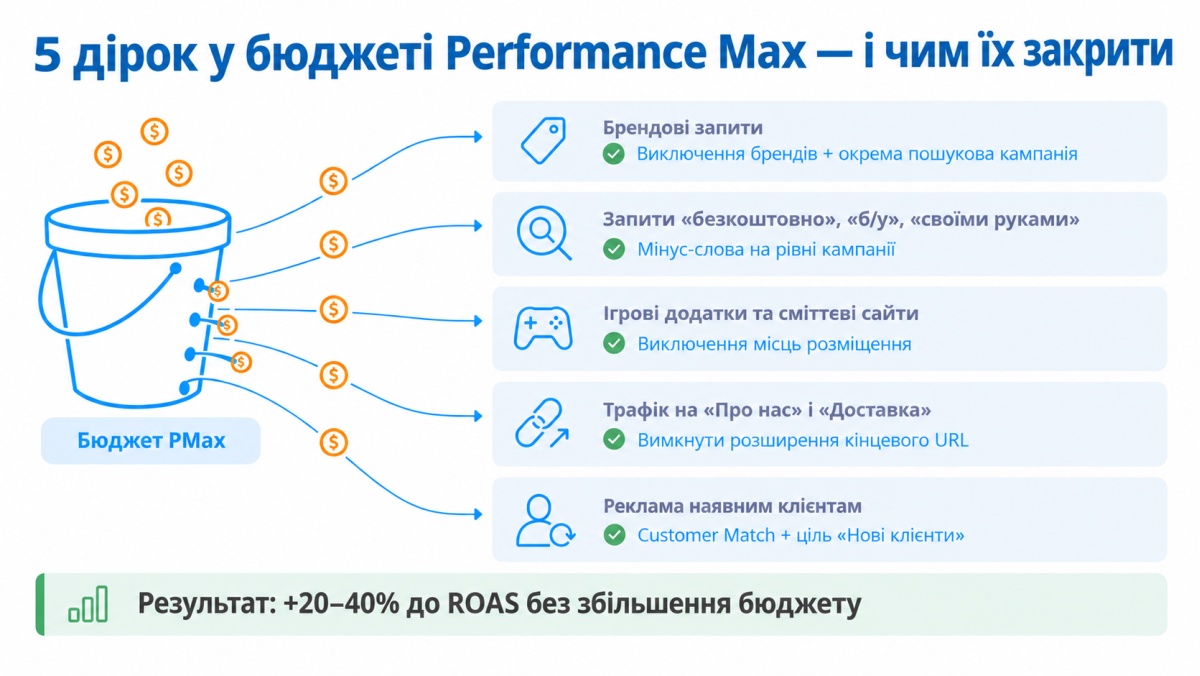
Herein lies the greatest potential: increasing profitability without increasing the budget. By default, PMax shows on everything, including your own brand—and brand traffic “paints” the prettiest ROAS in the reports.
A person searching for “Rozetka iPhone case” would have bought even without an ad. But the campaign will claim the conversion, show a 1200% ROAS, and ask for more budget. Meanwhile, the non-brand ROAS is hovering at 180%.
What to do during the first week of running the campaign:
- Brand exclusions. In the settings, add a list of brands you don’t want to show for—your own brand, store names, and domain. Drive brand traffic through a separate Search campaign with low bids.
- Negative keywords. PMax now supports negative keyword themes at the campaign level, not just through support. Add “free,” “used,” “DIY,” “manual,” “reviews”—anything with non-transactional intent.
- Placement exclusions. At the account level, block kids’ gaming apps, joke sites, and cartoon YouTube channels. The placement report under “Insights” will show you where your money is draining.
- Search themes. Add up to 25 themes per asset group—this is a hint for the algorithm, not explicit targeting, but it helps it find the right queries faster.
- Final URL expansion. If enabled, PMax can drive traffic to any page on your site, including “About Us” and “Shipping.” Turn it off, or provide a page feed containing only product categories and landing pages.
Another measure is excluding your existing customers. If your goal is new buyers, enable the “New customer acquisition” goal and upload your existing customer database via Customer Match. This ensures CAC (Customer Acquisition Cost) is calculated fairly, and you don’t pay for a repeat sale to someone who would have received an email newsletter anyway.
Audience Signals and Asset Groups
Audience signals are not targeting, but a starting hint. The campaign will begin with the people you specified and then expand to similar users. The difference between using signals and not using them in the first few weeks is substantial: the learning phase is shorter, and the initial conversions are cheaper.
The strongest signals are your own data:
- purchasers over the last 180 days (Customer Match);
- visitors who added to cart in the last 30 days;
- users who viewed 3+ products per session.
Google’s pre-built audiences (in-market, affinity) are weaker, but at launch, without your own database, they’re better than nothing.
Structure asset groups by theme, not “one group for everything.” A store with categories for “Baby Strollers,” “Car Seats,” and “Toys” means three groups with different headlines, images, and signals. Lumping all three categories into one group will result in a generic “Everything for babies” ad—and a “Low” performance rating.
Check asset performance ratings (Best / Good / Low) in every group. Replace assets with a “Low” rating every 3–4 weeks. Add your own videos: a 15-second clip shot on a phone performs better than an automated slideshow with a logo.
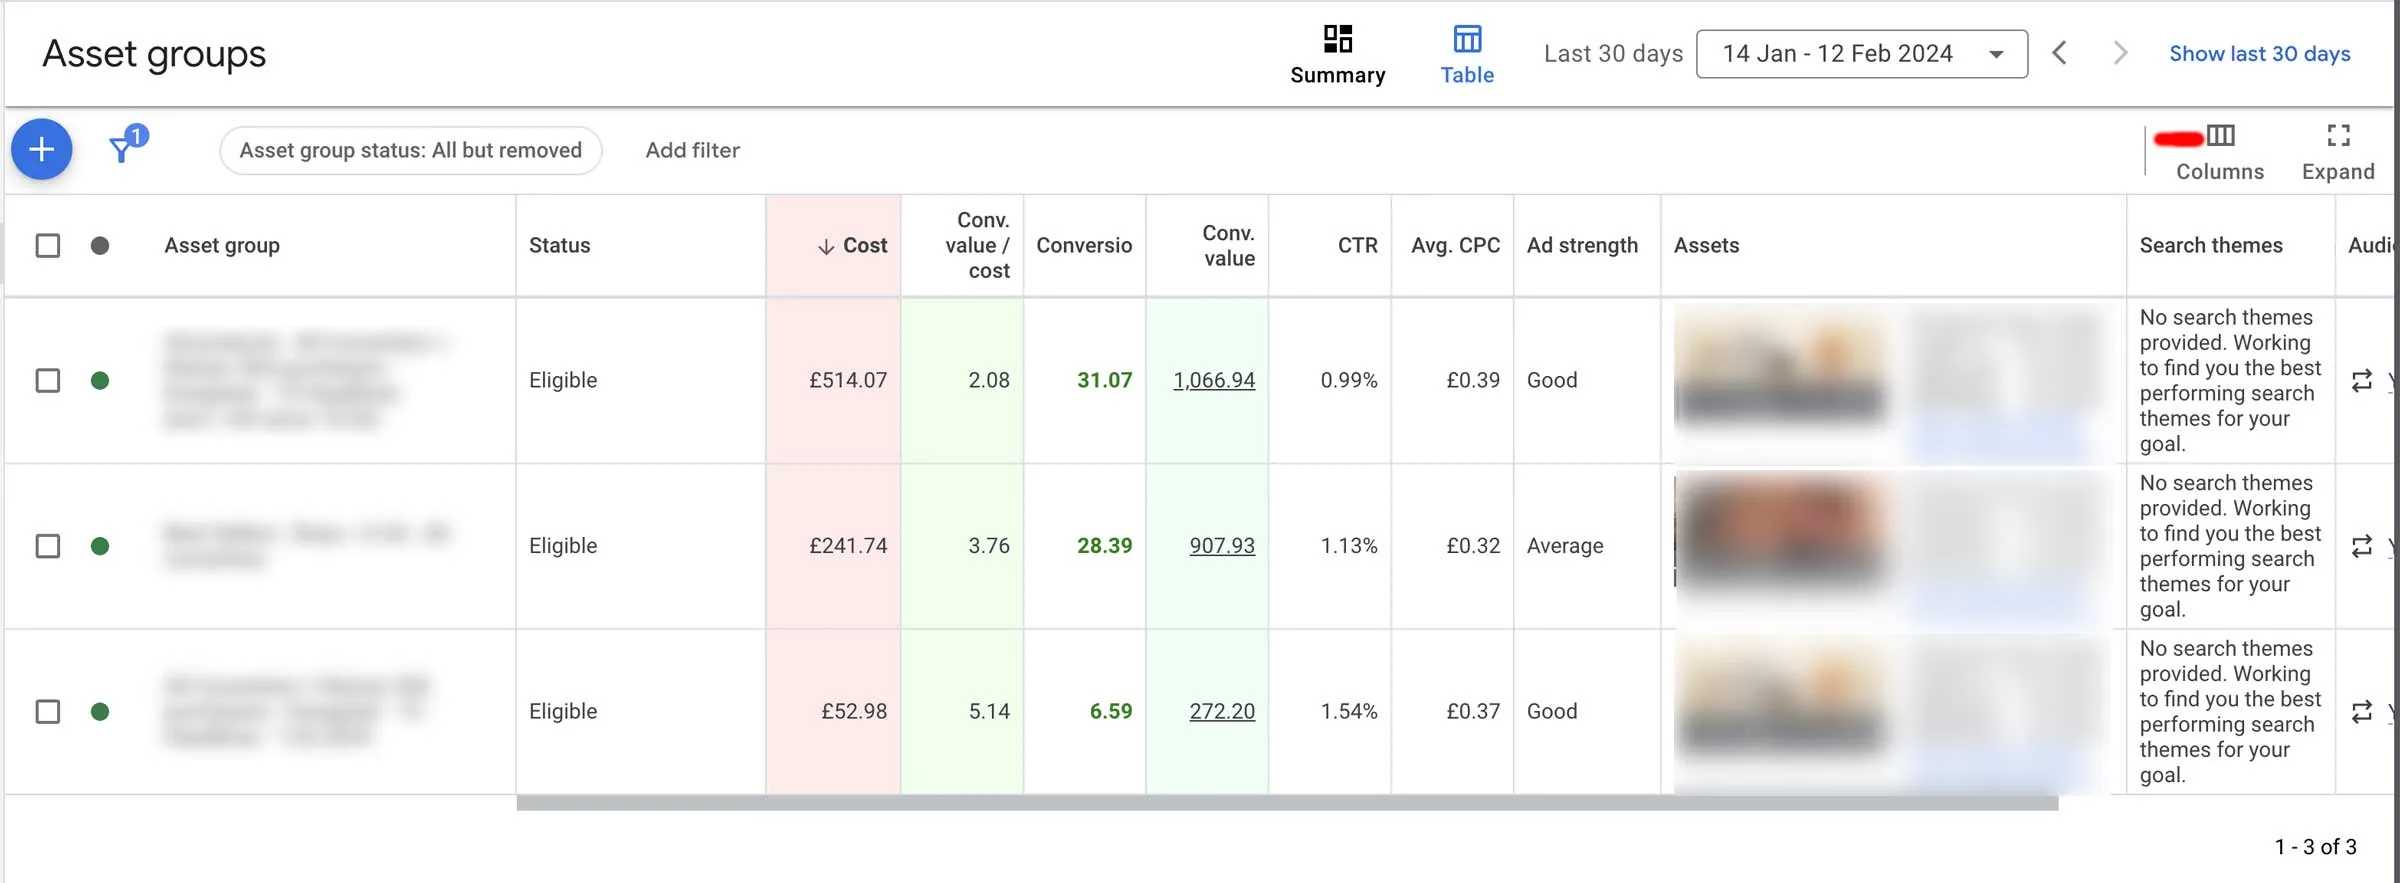
Tip: Do not run more than 3–4 asset groups in a single campaign. The budget is distributed unevenly, and the weaker ones will never gather enough data.
What to Look for in Reports to Understand Where Your Money Goes
Two years ago, PMax was called a “black box.” Now, there are plenty of reports; they’re just scattered across different tabs.
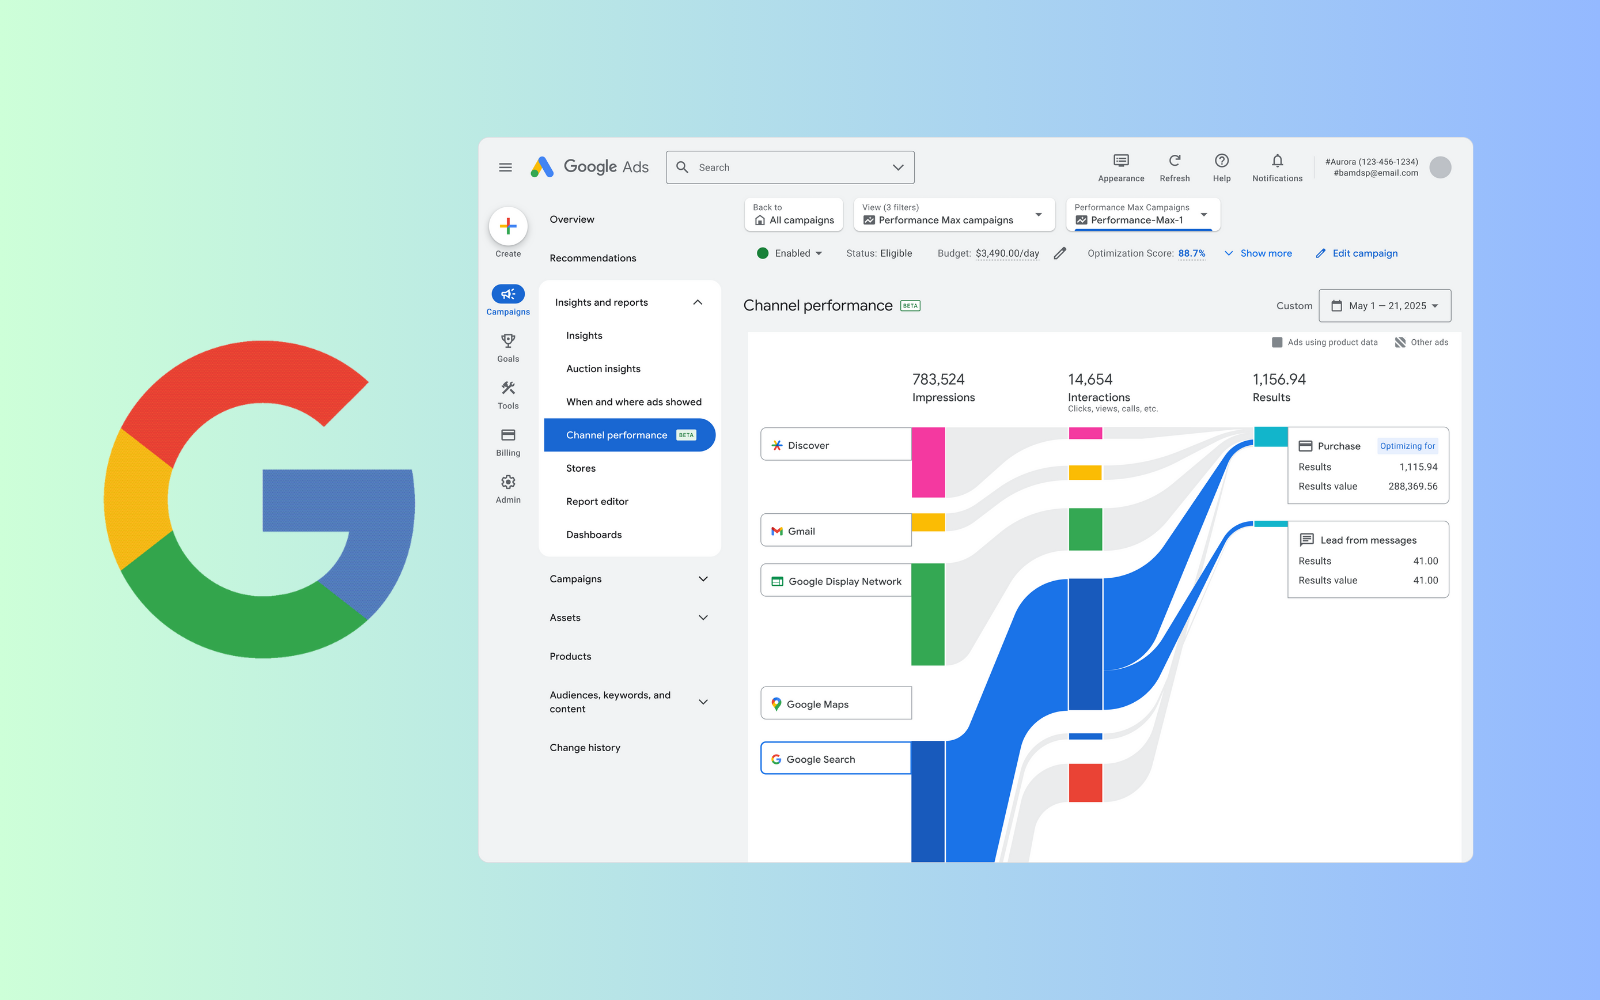
The Channel performance report breaks down spend and conversions between Shopping, Search, Display, YouTube, Discover, and Gmail. A typical picture for an online store: Shopping brings in 60–80% of revenue, Search adds another 15–20%, while YouTube and Display eat up 15–25% of the budget at a ROAS 2–3 times lower. You can’t disable a channel, but you can opt out of adding video (so YouTube gets less) and aggressively purge placements.
The search terms report reveals the categories the campaign responded to. Don’t just look at the top; look at the bottom of the list: that’s where “free,” “how to make it yourself,” and “specs” are hiding—everything that should go into negative keywords.
The “Insights” tab gathers the best-performing signals, demand trends, and auction shifts. If your CPC grew by 25% in a month, you’ll see it here: the cause is competitors, not your settings.
Don’t forget about Google Analytics 4. Compare PMax revenue in Google Ads against GA4 using data-driven attribution: if the discrepancy is over 30%, the campaign is cannibalizing conversions from other channels, and the true ROAS is much lower.
How to Increase Google Performance Max ROAS by Eliminating Cannibalization?
Performance Max takes priority over Standard Shopping campaigns containing the same products. Search campaigns only win if the keyword is an exact match for the query. PMax claims everything else.
Cannibalization looks like this: you launch PMax, ROAS hits 500%, great. But a month later, total account revenue hasn’t changed, while overall spend is up by 20%. The new campaign simply cannibalized conversions from the old ones.
How to avoid this:
- Brand queries belong exclusively in a separate Search campaign; use brand exclusions in PMax.
- If Standard Google Shopping is running in parallel, split the inventory: some products in PMax, others in the Shopping campaign, with no overlap.
- Keep exact match keywords in Search for the most profitable queries—there, you control the bid and the landing page.
- Evaluate revenue at the account level, not the campaign level, once a month. A pretty ROAS in one campaign is worthless if overall profitability hasn’t grown.
Budgets, Scaling, and Experiments
When a campaign hits its target ROAS and holds it steadily for 2–3 weeks, it’s time to scale up. And this is exactly where most advertisers break what was working.
The rules of scaling are simple, but rarely followed:
- Increase the budget by 10–20% at a time, no more than once a week. Jumping from 2,000 to 5,000 UAH a day will reset the learning phase.
- Don’t change tROAS and budget at the same time. One variable—one week.
- If ROAS drops by more than 15% after a budget increase and doesn’t recover within 10 days, roll back to the previous level. The campaign has hit the ceiling of effective demand.
- Instead of increasing a single campaign’s budget, it’s often more profitable to create a second one—for a different category, high-margin segment, or region.
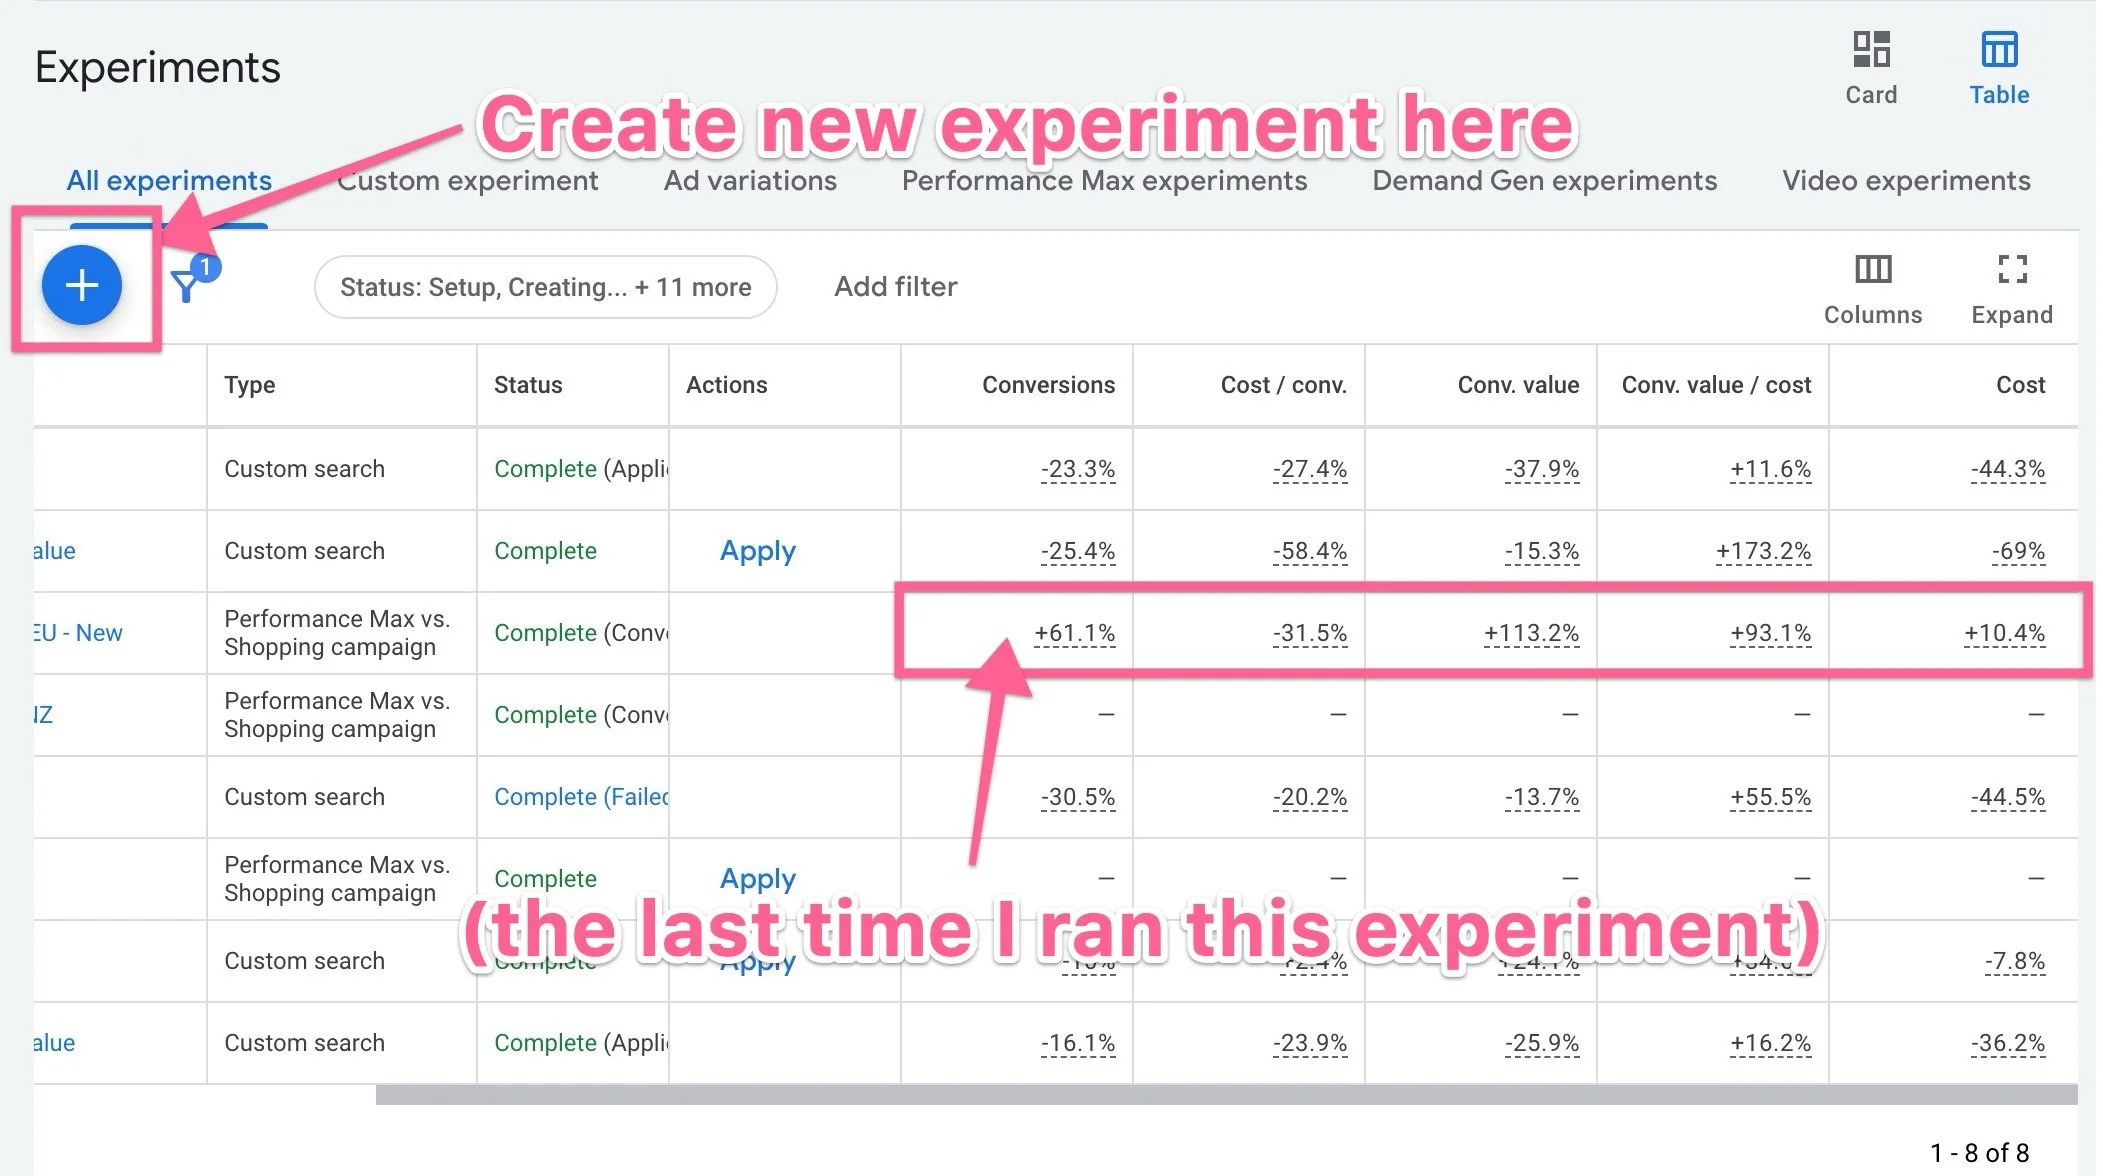
Experiments allow you to test a hypothesis without risking your budget. The most useful tests for PMax are:
- Performance Max vs. Standard Google Shopping on identical products—so you see incremental growth, not redistribution.
- Campaign with Final URL expansion enabled vs. disabled.
- Two tROAS levels split 50/50 on traffic.
Run the test for at least 4 weeks and change absolutely nothing in either arm. Otherwise, the results are random.
What Frequently Lowers Performance Max ROAS?
Briefly—what is most commonly found in accounts:
- Launching with tROAS on day one without accumulated conversions—the campaign gets no impressions;
- Evaluating results on day 3–5 and applying a new batch of edits—an endless learning phase;
- Dumping all products with margins from 10% to 70% into a single campaign with one tROAS;
- Missing brand exclusions—the ROAS looks great, but there are no new clients;
- Updating the feed once a week—half the products end up in an “out of stock” status;
- Passing conversion value as a flat amount or not passing it at all;
- Using one asset group for the entire inventory with two pictures and no video;
- Doubling the budget “for a sale” one day before the promotion starts.
Fixing just two or three of these points can boost your ROAS by 20–40% and improve PMax campaign performance without additional spend. This is the pure essence of Performance Max optimization: not looking for a magic button, but removing the obstacles preventing the algorithm from working for your profit.