
“Since mid-March, the site has been moved to a new platform, now there is a mobile version. Can you evaluate the effectiveness of this event? Of course, it is possible. The easiest way to find a solution to the issue, or rather to see the effectiveness, is to go to several reports. I say the simplest ways, they can be deepened and expanded.
You say mid-March? I think mid-March – around March 15, right? We take the current period, it is better to take more and compare with the previous period. Here I just took the previous period, ideally I would take the same dates, and ideally take the same dates with a period.
Analysis by device
Report in audiences by device. What is the task? The challenge is to see if user behavior has changed on mobile devices. For example, February 18 – March 14, there were about 10,000 users who generated 16,000 sessions. Bounce rate – 68, 2.45 flipped, 1 min were, the conversion percentage was 0.54.
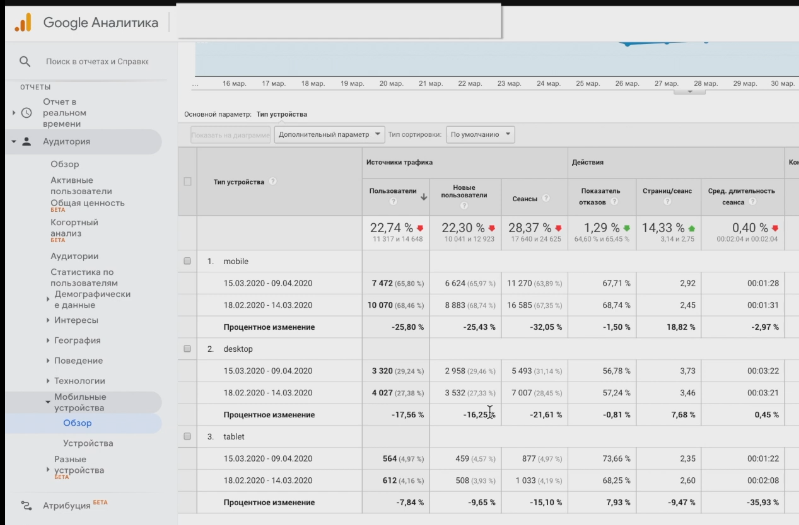
If we compare the previous figures, there are several facts. First, only seven thousand users who made 11,000 sessions, you began to actively lead to the site, it is convenient to use it. The bounce rate hasn’t gone down that much, page flips have gone up, but it’s still not a measure of efficiency. The main thing to look at is this indicator (checkout). What is the task? Do not reduce the bounce rate, do not increase page traffic, we are not a news resource. Our task is to make the coefficient, it is precisely the coefficient that grows. This ratio means the ratio of received conversions to the sessions that users have made. One user can visit a session multiple times on different devices.
Our task is to watch, this is the easiest option, you can also analyze how people switch from mobile to PC along the way, etc., but additional settings for user ID are already needed. Now you can see how well the mobile version started working, respectively.
Analysis of checkout
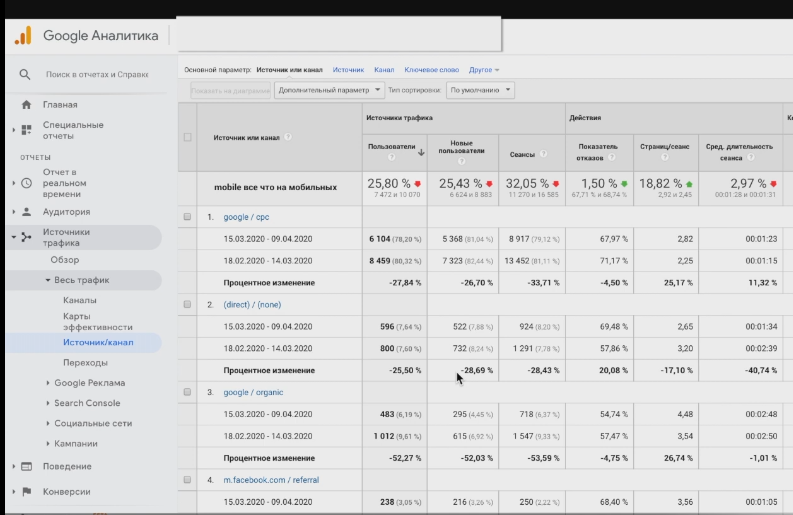
I would also analyze in the context of top traffic sources and conversions. Now let’s get to this analysis. I see now that the conversion rate has increased by one hundred percent. This is good, it means you make big conversions for fewer people. And another important point – conversions, you see, the number has grown by 42 percent, that is, it has become more convenient for people to do this ordering. I say this on the basis of this collected goal, which is fixed here. Real indicators need to be analyzed in the context of sales. On the desktop, not only did the conversion slightly increase, but perhaps because of the quality of the traffic that they did. Here is one story.
Browser analysis
You can look at browsers, operating systems, what is happening. Whether this story gets better or not. By browsers in general statistics, you can create a segment, add a segment for technology, select the type of device mobile – “does not contain”, but “exactly matches”, “mobile everything that is on mobile”, I’ll name it.
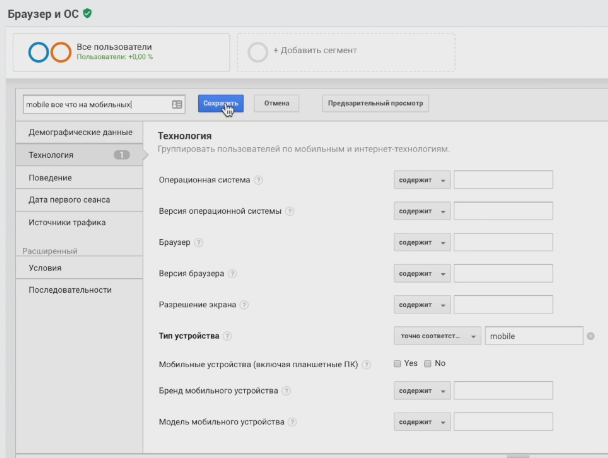
Let’s see what picture. Naturally, all users, as a segment, can be removed. Look, I’m deleting it. It remains mobile comparison, let’s see what happens. Chrome – conversion growth. By the way, the majority of the population of the planet Earth uses the Chrome browser. There are platform sites that show browser usage ratings – Chrome, Internet Explorer, Safari, I think, then Opera comes.
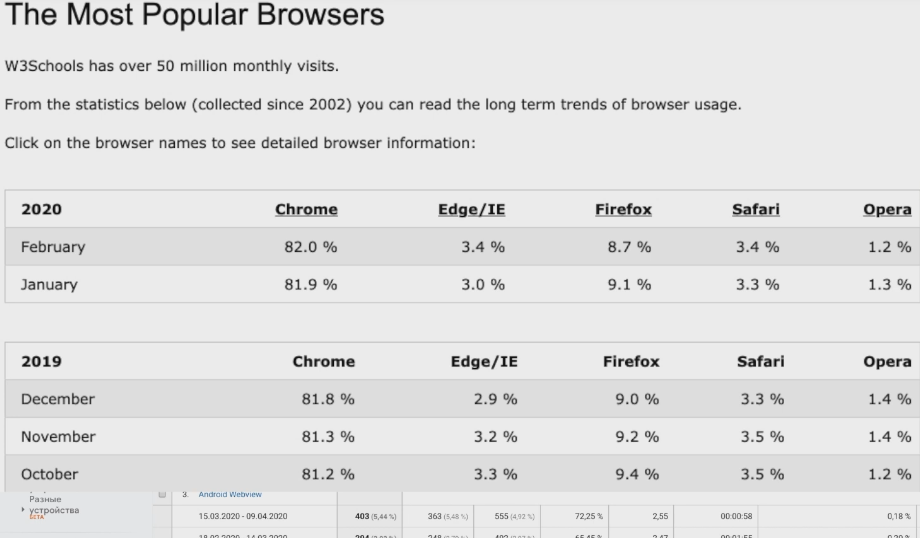
I see that Chrome, which is mostly top in terms of users and sessions – the conversion has increased. The number of conversions has increased, you see how many percent – it’s super cool. Safari – plus 11 percent, Safari – always especially important. Yes, the number of conversions has decreased, but the main thing is the conversion rate. Conversions have decreased – because there is less traffic. Androids – there is such a ratio, not a lot of statistics. Samsung Internet has increased. Opera – little traffic has gone, less than ten percent, there is not much point in analyzing them.
Site speed analysis
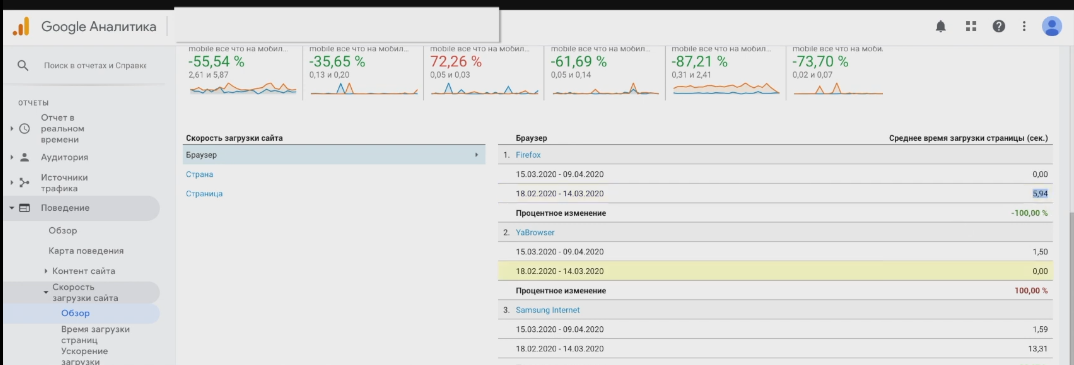
Let’s go to behavioral reporting, we need site speed. In the site speed, we will see how the loading speed of each type of browser has changed. For example, please, in Firefox it was 5.94, it became 0. In the Yandex browser, this is, we understand, there is a VPN. Some kind of Samsung browser – you see, up to 1 s. became. Safari – was almost 5, now it’s 2.24 (reference value). Chrome, there were six – it became the reference three with. Safari – such a ratio, it is necessary to look, perhaps there was simply little traffic. Well, Opera and Android Webview. The main share of indicators has improved.
You can do the entire analysis in terms of top traffic sources. What does top mean? If more than 10 percent of sessions are generated, you can freely analyze. For example, this is Google / CPC, direct, we cannot always influence it. We can still try organic, although it does not reach 10 percent.
Analysis of top traffic sources
For example, we take our google / CPC, and we can change our, for example, segment that we created. Let’s add a traffic source. Our source exactly matches “google”, the channel exactly matches the CPC. We are filtering sessions, the name is Google CPC mobile, save.
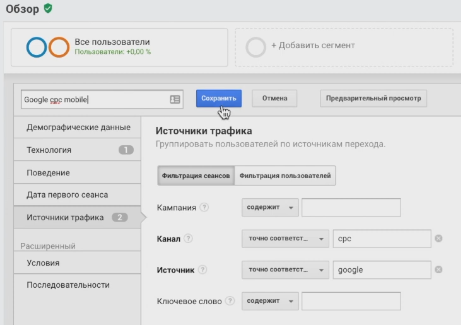
This is another segment created to make it easier to watch. You can take the same traffic, according to the same review, let’s see what happens. For example, paid traffic, thanks to the mobile version, the paid traffic ratio has increased by this amount on mobile devices. This is a complex segment, with it, you can rummage through absolutely all types of pages. If we go to “Site Content”, take “All Pages”, we will look at what happened to the site, mobile, namely with paid advertising on mobile devices, we will see how the number of page visits changed, what inputs / outputs were, output indicators. Failure rates got worse, improved. So try to analyze this story. But the downside of this deepening now, at the moment, is that there is very little page view traffic to make a definitive answer.
On mobile devices, the chain to communication, to the completion of the order, should decrease. Reducing the time on the site should hypothetically be correct from mobile devices because a person should get to the landing page as quickly as possible, make an order. This may be a problem with a specific, possibly traffic source.
These are the most primitive reports that will help you see what happened, whether the situation has improved or not. You can deepen the entire history to the behavior of pages, the speed of individual browsers on various traffic sources, and so on. It will only play into your hands. When we saw in the previous report that bounce rates slightly increased with Google / CPC, this is primarily due to the fact that Display Ads clicked a little, so I can’t make especially beautiful presentation results that everything is beautiful.