
Hello everyone! My name is Yana Lyashenko, and I’m a Google Logistician. Today I want to break down one of our team’s case studies. I’ll say right away: this material is more for those who love digging into numbers, understanding analytics, and getting to the bottom of things—why Performance Max delivers exactly these results and not others. However, if you’re simply looking for fresh ideas for your advertising campaigns, you’ll likely find something useful here too.
The format will be unusual. I won’t be bragging about cosmic metrics or drawing beautiful growth charts. Instead, I want to use a specific example to show that a specialist’s actions in an advertising account are not a set of random experiments or testing random hypotheses “what if it works.” Behind every decision is logic and reasoning backed by data.
And here’s why this matters. In the auto parts niche, some specialists hold the opinion that a good result is simply luck or a seasonal spike in demand. They say: season comes—sales go up, season leaves—they drop, and the specialist has nothing to do with it. With this case study, I want to show the opposite: how specific actions in the account directly correlate with results, and that far from everything can be chalked up to seasonality or randomness.
What period are we looking at?
The main segment for analysis is approximately from the 5th onward. This is the stage when the account has already passed its initial tests and started working more stably. The starting point is the 17th: that’s when we launched new campaigns, made key adjustments, and essentially began full-fledged project management. So all comparisons will be made relative to this date.
Which purchases were tracked for statistics?
In this project, we tracked purchases—and there’s an important nuance about which ones. Before our management began, the account used the purchase goal from Google Analytics 4 (GA4). It combined two types of orders: checkout via cart and one-click purchase. The logic is clear—both bring in a good volume of orders, so they decided to count them together as one conversion.
But it’s with this case study that I want to show the weak point of this approach—why the GA4 conversion works worse than a separate purchase tag. And what’s interesting: even with the modified attribution models currently in use, switching to the purchase tag produces a noticeable positive effect—including on that same purchase goal from GA4. I’ll show this with numbers below.
We separately configured tracking for cart checkout and one-click purchases—specifically to separate these flows and see statistics for each. For both goals, we connected EVC (enhanced conversion tracking), which provides more accurate data for optimization.
Brief overview of client periods and management
Now let’s go through the chronology—I’m showing real data so you don’t think I’m making up pretty numbers out of thin air.
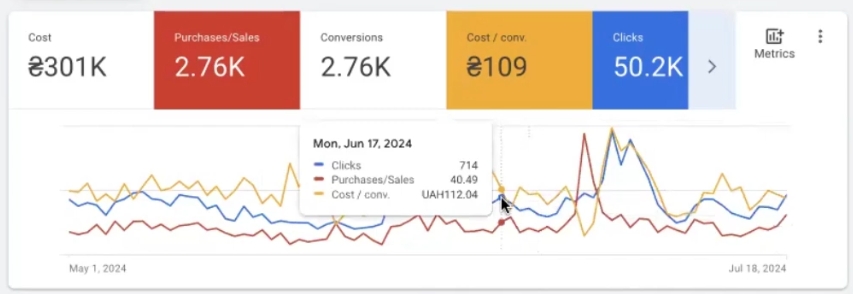
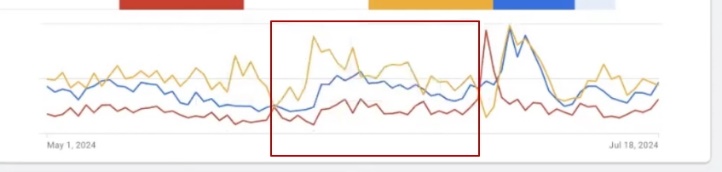
The overall average cost per conversion for the entire period under consideration is 2.76 thousand UAH. Looking at the graph, up to a certain point, the client had fairly steady going: conversions remained stable without serious drops. The average target cost per conversion fluctuated within 100–136 UAH—around 113, around 125, sometimes dropping to 100 UAH. Quite workable metrics.
Then the client tried to change something on their own—and chaos began. This is clearly visible on the graph: data drifted, structure broke. And that’s when our management started.
At launch, we started with a cost per conversion roughly comparable to those initial periods. At the same time, we got slightly more conversions in absolute numbers. We tried what we call a “spike”—an aggressive scaling test—but it proved ineffective, as clearly seen on the graph. In that period, we got 45 purchases, while for comparison: in one of the earlier stable segments there were 44, but now—noticeably cheaper.
Then the situation stabilized, another spike followed, and currently the data has stabilized—metrics are reaching an excellent level.
And here’s what’s important: those 50 conversions (sales) you see in the latest period are full, “whole” conversions. Not fractional values like 0.3 or 0.7 that were there before.
Where did these “half” conversions come from? This is a feature of GA4 tracking: GA4 distributes conversion value across multiple channels according to its attribution model, and as a result, you see not 1 conversion, but say, 0.4 here and 0.6 there. With the purchase tag, this problem doesn’t exist—one purchase = one conversion. What exactly was the problem with these fractional conversions and how it affected optimization—I’ll explain further.
The effect of GA4 operation
I build my basic results analysis on data from Google Analytics 4—and here’s why. The purchase goal from GA4 is the only one that existed in the account continuously, month after month. Therefore, only by it can periods be correctly compared with each other. I recorded this data in the “All Conversions” column.
Which periods are we comparing? First—May 15 to June 16, second—June 17 to July 19. Moreover, July 19 is still an incomplete segment, so it shouldn’t be fully relied upon, but it completes the overall picture.
What do we see in the numbers? Growth in purchase conversions is noticeable, and the cost per conversion in the new period came out significantly cheaper. And this is looking only at purchase from GA4—if we add one-click purchases (which, by the way, we reworked and fixed to trigger correctly) and the purchase tag, the picture becomes even more interesting.
If we sum up all these goals, the total number of conversions will be slightly higher than what purchase shows separately. But in reality, the client had significantly more orders than analytics recorded. There were quite a few “dirty” conversions in fact, while “clean” ones were around 1,500 as of before July 14. I’m showing data up to the 18th—specifically so you can see how this affects the overall picture. I’ll explain in more detail below.
Setting up enhanced tracking, purchase tag, and stabilizing decline
What tasks did we face at the start? First—set up enhanced conversion tracking and the purchase tag so that data is transmitted correctly and Performance Max gets maximum “fodder” for learning. Second—stop the results decline that had already begun before our management. So we didn’t break anything—the fading was already happening at the time of account handover.
It looked like this: the number of conversions was dropping, at one point there were only 12 left for the period, the cost per conversion spiked sharply—and then these “swings” only intensified.
What could cause such a decline? There can be several reasons, and they often overlap. For example, there were enough clicks in the account, but machine conversion modeling on this particular project worked incorrectly. Possibly, GA4 itself was letting it down—Google is constantly improving it, and in the process, it can glitch. Plus, GA4 in general isn’t always suitable for accurate tracking and scaling results in most accounts.
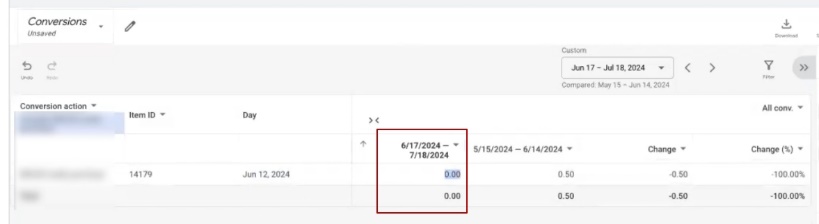
How to check that the problem is indeed this? I assembled a special report in the Google Ads report editor. Structure is simple: took “Conversion action,” item ID, broke down data by days, and filtered only purchase from all conversions. I equalized the comparison periods: May 15–June 14 versus June 17–July 18—approximately equal-length segments.
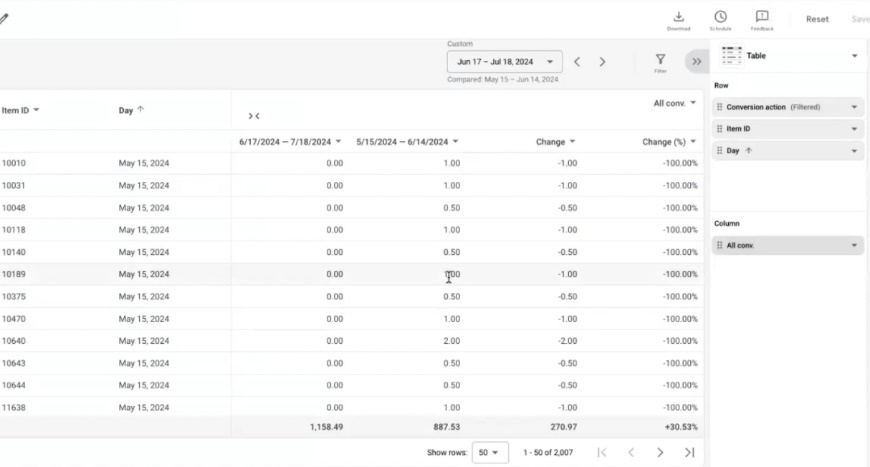
Why am I showing specifically on purchase? Because on the purchase tag, this difference isn’t as striking. But something else is visible—how positively competent work with advertising campaigns affects overall results. GA4 “doesn’t notice” many cross-sells and accompanying orders, while the purchase tag records them. This is exactly why it remains the best type of conversion for Performance Max—and provides significantly more useful analytics for decision-making.
At the time of recording, we had only one month of management. During this month, we tried quite aggressively to break through accumulated problems. It doesn’t always work on the first try—but the longer you manage an account, the more stable the result.
And here’s what’s important to understand: fluctuations and spikes in Google advertising campaigns are normal. Google’s advertising tool isn’t static, it changes constantly. And “constantly” doesn’t mean once every six months or once a year. These are very frequent updates.
Google Merchant Center’s policy checks alone change approximately once a quarter, if not more often—I wouldn’t be surprised if it’s once a month. Not to mention the advertising algorithms themselves, which have artificial intelligence built in? So you need to be prepared for regular adjustments—it’s part of the job, not an exception.
Let’s figure out the key problem I want to draw your attention to. Google Analytics 4’s attribution model is what often prevents Performance Max from working at full strength. Even if you seemingly set everything up correctly.
By the way, on July 12, the client’s account had the “last click” attribution model set for paid channels only. But even this turned out to be insufficient for Performance Max to work correctly based on GA4. Despite the fact that only Performance Max campaigns were running in the account—no other types.
How to identify the real number of orders?
To show you how many full-fledged orders Performance Max actually generates, I formed a report for the previous period. The goal—to see the real picture, not the one GA4 paints with its fractional conversions.
What did I do? Took a report by Item ID, filtered only purchase, and set the condition “more than one conversion” for each item. You can easily reproduce this filter in your own account to check. Essentially, this filters out so-called “non-longtails”—items that sell stably and make more than one conversion per period.
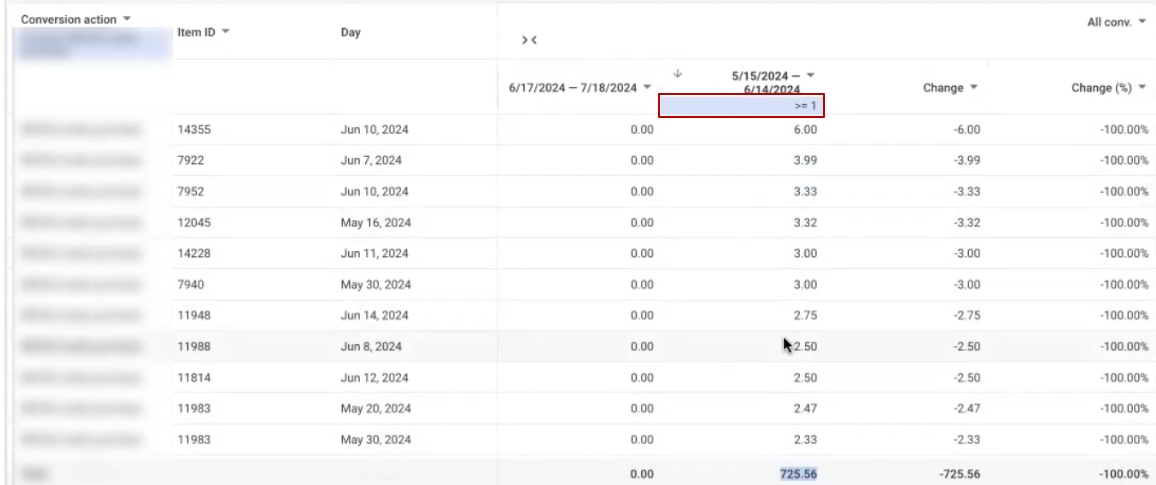
What came out in the old period (before our management)? With the “more than one conversion” filter—725.56 conversions. Yes, those fractional values from GA4 are still present here, and there are indeed many of them. If you remove the filter completely, the system shows 887 conversions. The difference between 887 and 725 is 162 conversions that the system added as a positive result, when in fact it’s “noise” from fractional attribution.
In previous periods, campaigns operated on completely different mechanics—different model, different approach to scaling and adjustments. Our task was: to try scaling advertising campaigns within existing KPIs, increase volume in absolute numbers, and reach larger figures to build upon in future work.
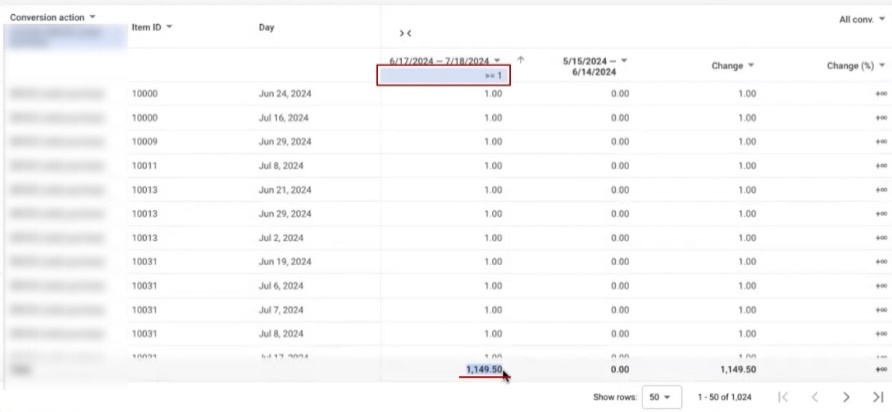
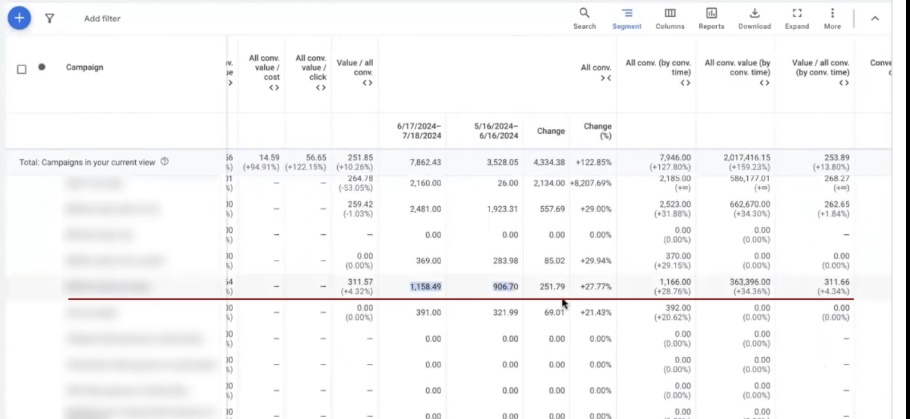
Now I apply the same filter—”more than one conversion,” same purchase goal—but to the new period when campaigns were running on the updated scheme. Result: 1,149 conversions (even accounting for the halves). At the same time, the fractional values themselves became noticeably fewer—this already indicates that the data has become cleaner.
And now simple arithmetic. There were 725 conversions, became 1,149. Divide 725 by 1,149, get approximately 63%. So the growth was about 36.6%. And this is—with the same selection rules, with the same halves, but on item positions that show stability from period to period.
Here’s what’s interesting: if you look at the overall numbers in the advertising account interface, the growth looks like a modest 27%. But in reality, when you dig deeper and analyze by item positions—it’s at least 35%, if not more. GA4 simply “spreads out” the result with its attribution model, and you don’t see the full picture.
For correct comparison, I equalized the periods: May 15–June 14 (before management) and June 17–July 18 (after launching new campaigns). A small shift of one or two days is acceptable—the main thing is that the segments are approximately equal in duration. This is exactly the comparison on which the objective evaluation of Performance Max efficiency in this project is built.
Comparing results in cost per conversion
Now the most interesting part—let’s calculate what each conversion actually cost. After all, growth in absolute numbers is great, but without tying it to expenses, the picture is incomplete.
We take cost and conversion data for both periods. Important point: costs are actual money spent on advertising, attribution model doesn’t affect them at all. Whatever Google Ads charged—that’s what went out, no fractional values or tricks here.
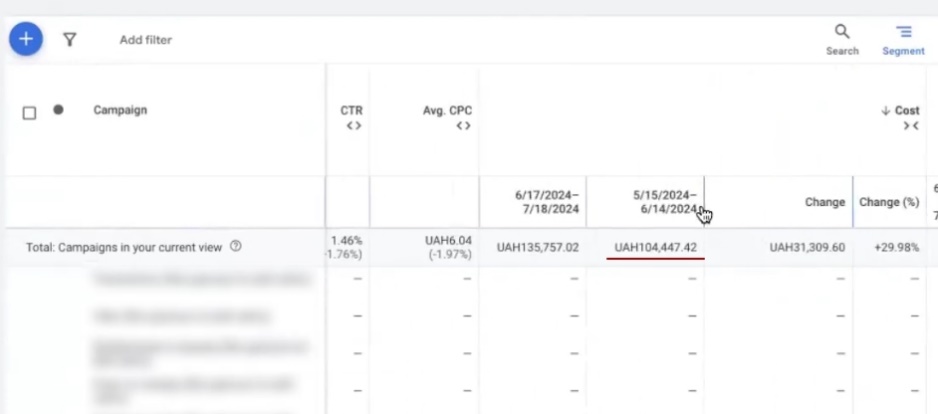
Calculating for the old period (before management): cost was 104,447.42 UAH, conversions (those same “non-longtails” with filter more than one)—725 units. Divide: 104,447 / 725 = 144 UAH per conversion. Remember this number.
Now the new period (after campaign restructuring): cost—135,757 UAH, conversions—1,149. Divide: 135,757 / 1,149 = 118 UAH per conversion.
Comparing: 118 / 144 = 0.82. Minus one—we get an 18% reduction in cost per conversion. And this is despite the conversion volume growing by 35%.
This entire calculation I conducted exclusively on purchase from GA4—without accounting for the purchase tag, which wasn’t set up in previous periods. So such a comparison is simply impossible by tag. But even on GA4 data with its fractional conversions, it’s visible: absolute numbers grew by 35%, while cost per conversion dropped.
I understand that the analysis looks quite simple, and somewhere the numbers aren’t perfectly smooth. But the result is no less indicative because of it. Especially consider: in the new period there were those same “spikes”—aggressive scaling attempts when cost per conversion temporarily jumped, and then had to be brought back down. Despite these spikes, the final average still came out cheaper.
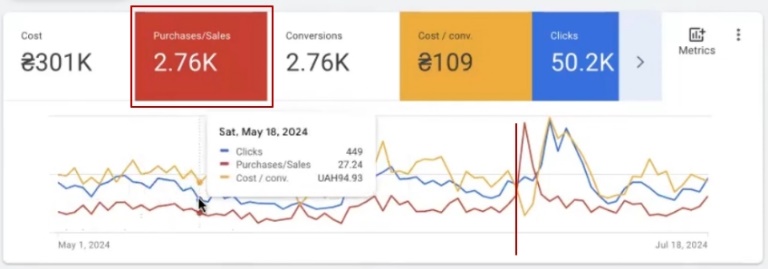
If you look at a stable segment—approximately July 5–6 onward—there the cost per conversion stabilized to 109 UAH, which practically matches the best values from earlier periods. And here’s what else stands out: conversions in this segment went in more “whole” numbers—36, 39, 40, 50 units.
For comparison: before, fractional values like 0.4 or 0.7 constantly appeared—this is a consequence of GA4’s attribution model and how it “spread out” one-click purchases across channels. But now, for example, on the 18th exactly 50 conversions were recorded—clean, full-fledged. This once again confirms that switching to the purchase tag and separating goals gives Performance Max much more accurate signals for optimizing advertising campaigns.
What’s the flaw in GA4?
Despite the fact that I built all previous analysis on Google Analytics 4 data, it has a serious flaw you need to know about. Now I’ll show with a specific example what exactly GA4 misses—and why Google’s purchase tag handles this task significantly better.
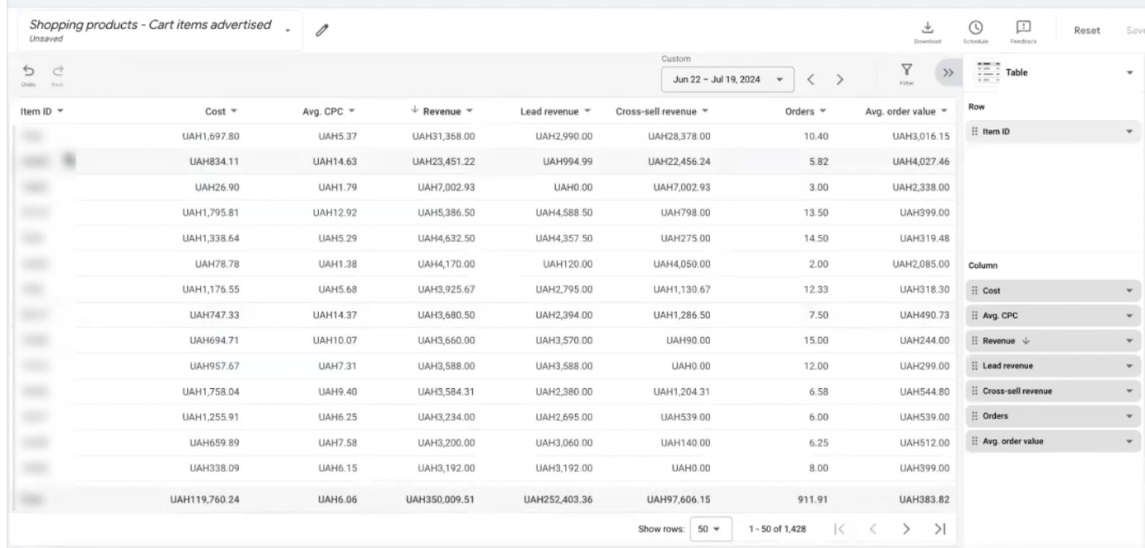
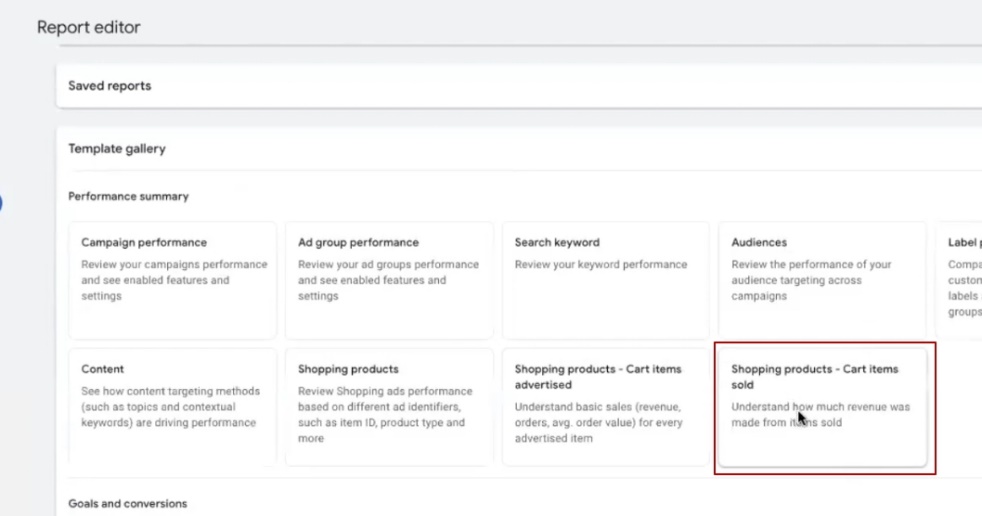
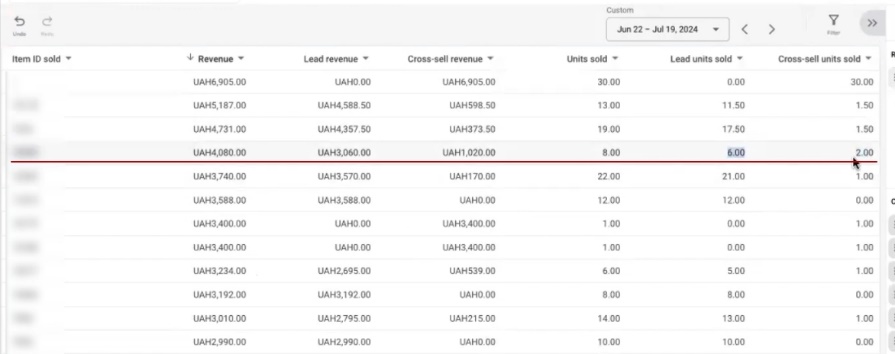
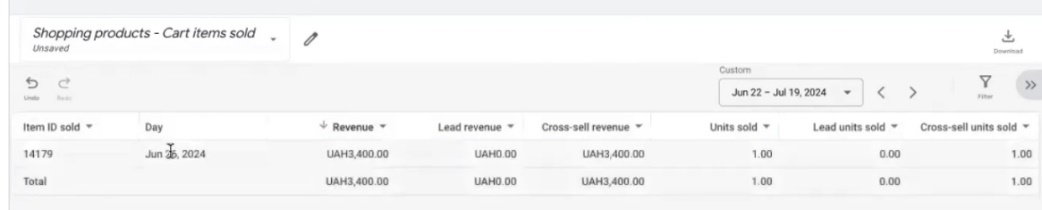
First, we need a cross-sell report. Forming it isn’t difficult: go to the Google Ads report editor, find the block called approximately “Shopping—Products Sold,” open it. I remove the “Product Title” column to avoid cluttering the screen—item IDs are more important to us than their names.
Unfortunately, we can’t compare this report with the period before our work began. The reason is banal: in previous periods, item IDs in the account weren’t highlighted and weren’t transmitted. If you select old dates—the Item ID column is simply empty. So we work with what we have: period June 21–July 18.
Imagine the situation: a person clicked on an ad for an oil filter, went to the site, and ended up buying not only the filter but also brake pads. The pads in this case are a cross-sell. The click was on one product, but another one sold too.
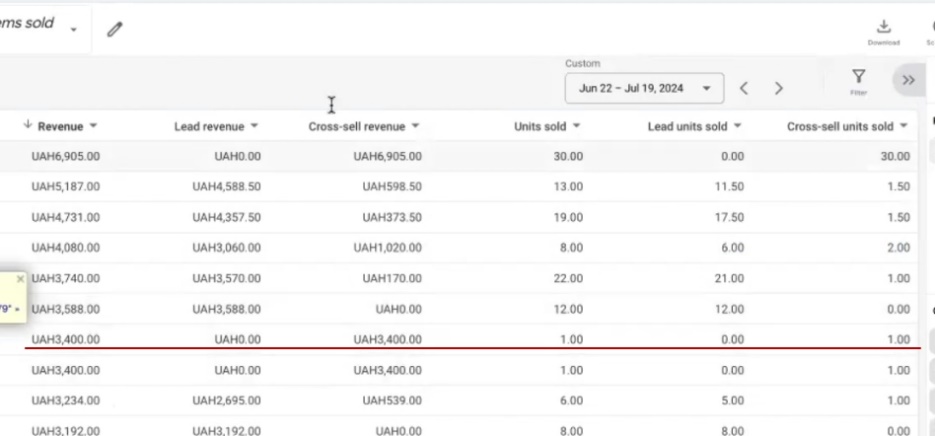
So, the purchase tag in Google Ads sees and records this cross-sell. It notes: “there was a sale on this item position,” even if the click originally came through a completely different product. And—critically—uses this information for further optimization of Performance Max advertising campaigns.
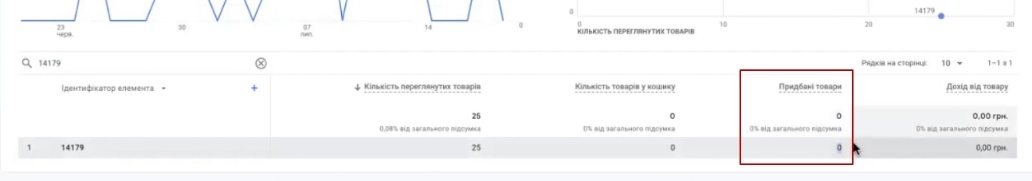
And now let’s check what GA4 will show. I take a specific example: item position with ID 14179. In the Google Ads cross-sell report, it’s present—you can see there was a sale on it. But if I turn to GA4 and try to find this same ID for the same period—there are no conversions on it at all. Zero. Not even fractional ones.
I try through the analytics report editor: remove all filters, enter ID 14179, apply—and again empty. GA4 simply doesn’t see this sale.
Going further. I add day breakdown (parameter “Day”) to the Google Ads report, find this item position, and see: the cross-sell happened on June 26. And in analytics for this date—nothing. The sale happened, the client received money, but GA4 doesn’t even suspect this.
This is where the fundamental difference lies. The purchase tag records the real picture of sales—including all accompanying products that were bought along with the advertised one. GA4 can’t do this: it ties to the attribution model and only counts direct sales on positions that were clicked. Everything that sold as an “add-on” simply doesn’t exist for it.
And here’s what this means in practice: when you use purchase from GA4 as the main goal for Performance Max, the algorithm gets incomplete data. It doesn’t know about part of real sales, which means—it can’t optimize correctly. The purchase tag solves this problem: it transmits complete information to Performance Max, including cross-sells, and the algorithm can make more accurate decisions about which products and audiences to bid on.
Why is proper account management necessary?
This is exactly why, when specialists advise switching from GA4 to the purchase tag—they’re right. But the switch alone won’t give results if competent work in the Google Ads advertising account isn’t being done in parallel.
Perhaps this will sound immodest, but I can’t help emphasizing: the result you see in this case study was made by the team’s hands. Not by algorithm, not by seasonality, not by a lucky coincidence. Behind every number is specific work: bid adjustments, campaign structure changes, excluding irrelevant traffic, filtering search queries, proper Google Shopping structure—dozens of factors that together determine what “fodder” you’re feeding your Performance Max.
At first glance, it may seem that the result appeared by itself. First a baseline level, then one jump, a second—and a positive dynamic is already emerging. But behind each of these jumps is a specific action in the account.
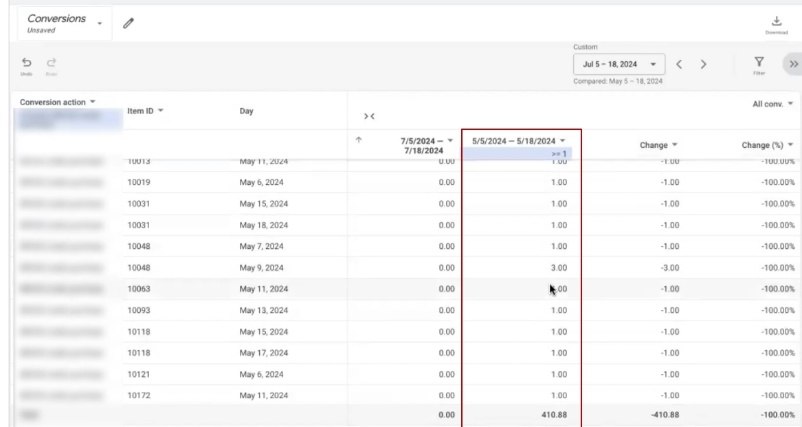
To prevent this from looking like an unsubstantiated claim, let’s compare specific periods. I take the segment July 5–18—this is the stage after making main adjustments, when campaigns were stabilizing. And I compare it with a similar segment in May (May 5–18), because in May there weren’t yet those interruptions and chaotic changes that happened later.
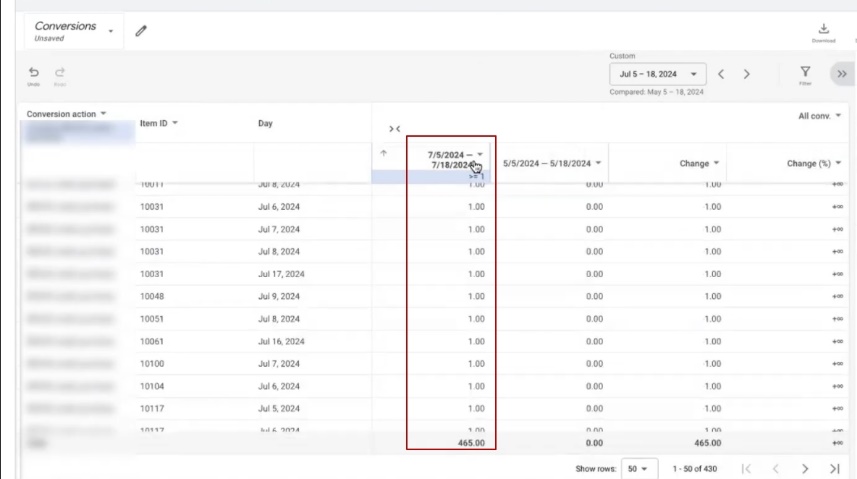
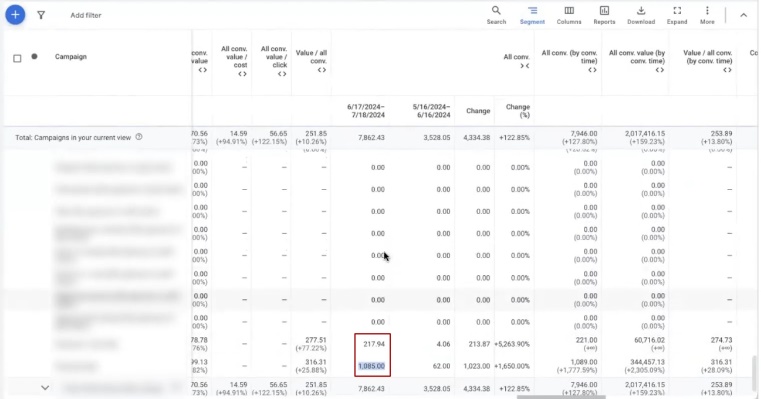
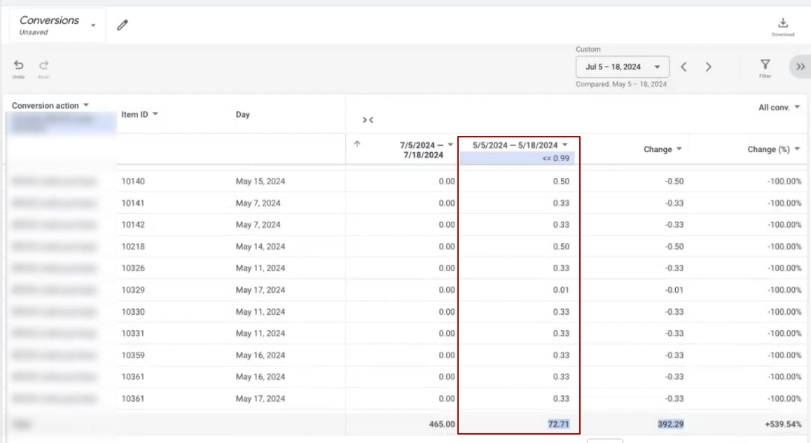
To make the comparison fair, I count only by purchase from GA4—without the purchase tag, by the old model. I set the filter “greater than or equal to one”—get 410 conversions for the July period (even with halves). If you remove the filter completely—the system will show 487. And if you separately filter fractional values (less than or equal to 0.99)—you’ll see all these 0.5, 0.02, 0.3, which together give 72 “conversions.” In fact, this is noise from the attribution model, while real sales are 410.
By the way, I’m showing everything step by step specifically so you can reproduce this same analysis in your account and verify.
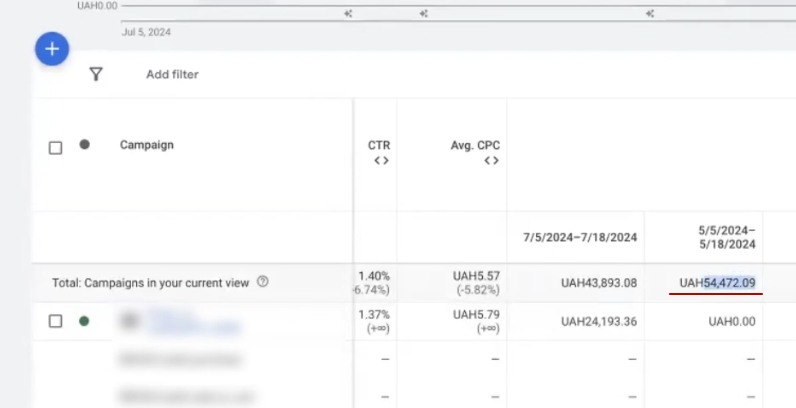
Now the most telling—costs for the same periods:
- May (May 5–18): cost—54,472 UAH, conversions—410. Cost per conversion: 54,472 / 410 = 132 UAH. And this is a “dirty” number—the real cost is likely even higher, because among these 410 there are fractional values.
- July (July 5–18): cost—43,893 UAH, conversions—465. Cost per conversion: 43,893 / 465 = 94 UAH. Also with halves, but significantly fewer here.
In total: cost decreased, conversions became more, and cost per conversion dropped from 132 to 94 UAH. And this is—on the same GA4 data, by the same counting rules. The difference isn’t in methodology, but in how exactly the setup and optimization of advertising campaigns was conducted during this period.
Analysis of adjustment results
Even if we take this relatively stable segment—after all tests and fixes—you need to understand: in four weeks of management, making a sharp, explosive jump in results is extremely difficult. Yes, when enough analytics has accumulated, you can try to “break through the ceiling” with aggressive scaling. But, as we’ve already seen, such attempts don’t always end successfully.
What happened in practice? Around May 5, clicks dropped, conversion cost went up—and we had to roll back to previous parameters. Gather patience, wait for stabilization, and make completely different fixes—more careful, targeted ones.
Important! For comparison, I deliberately chose not the most successful piece, but specifically a stable one. I didn’t include the 19th, when cost per conversion spiked again. I took a more or less even segment—and even on it, it came out to 132 UAH accounting for fractional conversions. And in the July stabilization period—94 UAH.
Now calculate the difference: 94 / 132 = 0.71. So the cost per conversion reduction was about 30%. For comparison: when I analyzed the overall period in full (from the 17th and previous four weeks), the reduction was 18%. And here, on a cleaner stable segment—already 30%. And this even accounting for intermediate values of 109 and 139 UAH that occurred within the period. I specifically compared with that May segment that looked quite decent—not with the worst one, but with a normal working level.
Conclusions
The main goal of this case study is to show that in Google Ads advertising and Performance Max work, there are no accidents. Yes, there are factors that a specialist doesn’t directly influence. Seasonality, demand fluctuations for certain product categories—all of this certainly affects overall dynamics, both positively and negatively.
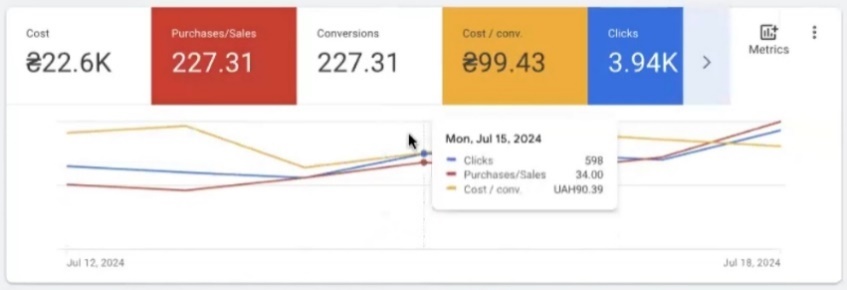
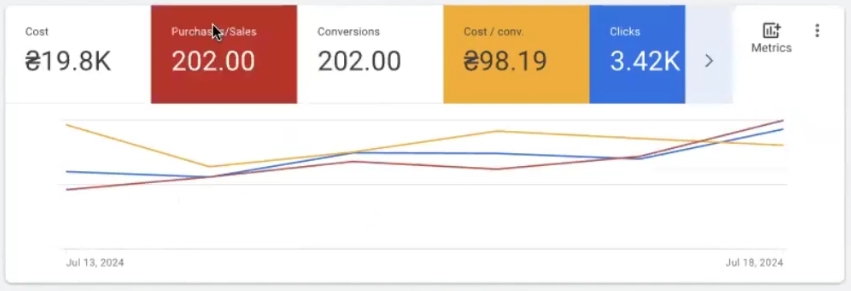
But look at this account: there are no sharp drops where conversions suddenly collapsed to zero. The set goes smoothly—conversion count gradually grows, price stabilizes. To see this in equal proportions, let’s take, for example, an incomplete week from the 13th to the 18th. Here 202 conversions were recorded (purchase—for skeptics I clarify: yes, specifically purchase, you can check in the Conversions column). And cost per conversion—98.19 UAH.
This is what a stabilization period looks like, when a specialist understands what data they’re working with. Moreover, analytics in Google Ads isn’t instantaneous. You can’t look at today’s numbers and draw conclusions: today there may be noticeably fewer conversions, and the day after tomorrow, when data “catches up,” you’ll see a completely different, much more complete picture for those same days. A competent specialist knows this and knows how to work with it—doesn’t panic over temporary drops and doesn’t make hasty decisions based on incomplete data.
This is the case study I wanted to demonstrate to you. Not about cosmic numbers and beautiful screenshots, but about how setting up Performance Max for auto parts is systematic work, where every action has reasoning, every adjustment relies on analytics, and the result is a consequence of expertise, not luck.