- Report in Performance Max “Search queries”
- Important when analyzing search queries in Performance Max
- What are the tasks involved in traffic adjustment in Performance Max?
- Choosing words for minusing using a script
- Script execution results
- Category Insights tab
- CategorySplit tab
- PMax_SearchTerms tab
- BrandSplit tab
- NegativeIdeas tab
My brand traffic has been eaten up… My ROI isn’t converting… What should I do? Plus, I’m filtering traffic, but it’s not helping. Please advise what to do. This is a typical request regarding Performance Max, because specialists or businesses don’t understand what’s going on with advertising campaigns, which traffic leads to conversions, and which doesn’t. In general, it can be traffic or not traffic. And this is especially relevant after Performance Max allowed adding an unlimited number of negative keywords. This problem has become even more exaggerated. Let’s figure it out.
Report in Performance Max “Search queries”
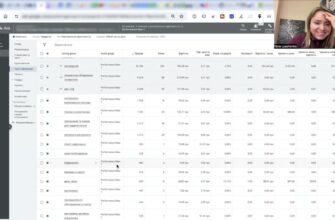
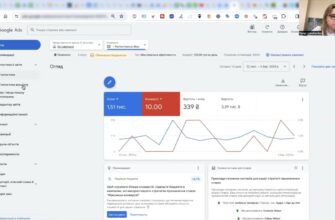
In Performance Max, you can see a separate report called “Search Queries.” Go to “Campaigns.” Here you will find “Statistics and Reports” and “Search Terms.” Here you can even select the most effective campaigns and view search queries.

How many calls and sales will I get by ordering contextual advertising from you?
I need to calculate the conversion of my website Describe
the task
in the application
Calculate potential ad revenue Google
contextual advertising calculator
Important when analyzing search queries in Performance Max
One important detail to keep in mind when analyzing search queries. First, not all search queries generated by Performance Max are extracted there. This is a very important detail. You don’t see everything.
Second, not all queries that seem super irrelevant to you may actually be irrelevant. This is an important nuance. Sometimes Performance Max can enter other people’s auctions. That is, you may see a query that is not specific to your niche and think, “That’s it, it’s over. Performance Max doesn’t understand what it’s doing at all.” It understands perfectly well. It’s doing the tests correctly. You all like to talk about the five days of training that Performance Max conducts at launch. It does this constantly, A/B testing different traffic options, because the competition is not only direct.
You sell cups, and someone else sells the same cups — that’s direct competition. There are, for example, glasses, an analogous product that satisfies the user’s need. Analogous products include bottles, jugs, cans, buckets, and anything else you can drink coffee from, right? There are also products that you don’t consider to be your competitors, but they may be competitive analog auctions that Performance Max can get into. I don’t know, maybe people are searching for iPhones, maybe some light bulbs, maybe some pens, in order to buy a cup. And that’s also OK, because Performance sees from your customer avatar that such a user may potentially buy our product.
Don’t think that a query you see is completely irrelevant and that Performance Max doesn’t understand who to show it to if everything was OK before. Or, for example, such a situation can only occur if you see really incorrect traffic in the majority of all queries. This is very common with products when you attach an MPN to your products, this SKU code, article number, manufacturer code, all of which identify it differently. If you google it, it’s not your product that comes up, but something completely different. This is a typical situation where traffic can be very dirty.
Or you made a very simple feed. This happens less than 1% of the time, but it does happen.
In all other cases, this analysis should be approached as a diagnostic tool. You can substitute these queries. For example, you can substitute “handles” for cups. OK, then let some other Performance work without substituting these “handles,” because we don’t know why it got into the “handles.”
Previously, Google hid this data in Smart Shopping and Performance Max for a reason. Not just because it was hiding money there, but because it often happens that your sales are pulled from related auctions that are not related to your product at all. And that’s OK. The main thing is that they are similar. It shouldn’t be the case that you are selling pastila, and there are ads for combine harvesters and vice versa. They can still be similar to each other. This is the next very important nuance.
Third. Not all of your brand queries that you can see eat up all your margin. And, in general, Performance is wrong. And all the revenue he draws is only from brand traffic. And all sales are only brand traffic. And help, save us, help! No, this can also be the norm, because, look, in the 25th, 26th, and subsequent years, users never buy from the first click. Yes, there are niches of such a hot emotional buying process when you come in, grab a basket, and leave. Like, you know, you go to the subway, to the “Everything for 5 UAH” stores or this Aurora, you go in, and then everything is like in a fog. Something like that.
But in most cases, even in Aurora, before buying on the site, a user may visit your site several times, go to YouTube, TikTok, Instagram, various pages, and then return to you because they read something about you or remembered you somewhere. Therefore, excluding a brand is not always the right thing to do. You just need to try to analyze whether this brand has such an aggressive impact on your advertising. I will show you this format here.
What are the tasks involved in traffic adjustment in Performance Max?
In Performance Max, traffic adjustment boils down to several important options for solving problems. See, it’s not about eliminating certain problems or whether it’s the right thing to do. In a regular store, it’s better to underestimate than to overestimate when collecting traffic.
In Performance, what I see now when looking at different accounts is that your task is to adjust traffic: either you try to shift its focus to a completely different audience, in which case it makes sense to filter traffic, or you want, for example, to conduct some kind of level structure test.
When you generate different types of search queries in different performances with a single goal, because different search query options have different conversion rates. And you do this in test mode. In all other cases, you can only filter out the most obvious negatives, because even that one word, whether it’s “cars” or “pen,” can actually sell quite well.
Choosing words for minusing using a script
How can this be understood? So as not to sit and sift through thousands of words, there can be many or very few of them. For example, I have a list here, let’s take the last 14 days. There are 113,000 requests for maximum efficiency campaigns here.

Going through them all can drive you a little crazy, not only with your mind, but with everything else, and you just end up living your life sorting through this traffic. You can optimize the format of working with them a little. First, we can run a script like this. It’s better to run it with the smallest number of days so that it’s easier for you to group and sort through everything and so that it works faster.
What do you need to fill in here? Here you need to fill in the formats of your brand queries. If you have them, it is better to fill them in at least in some format, with spaces, without spaces, in Cyrillic, in Latin, as people google them. If necessary, you can always add to this list in the column.
Categories. What is a category? It is not automatically categorized. You name the category yourself in some way, preferably using Latin letters. And you write down all the categories of these queries that may occur there, separated by commas. “Pen,” “pencil,” “black,” “green,” however you want to categorize these queries. This is generally a free-form process. “Brand own” — here you will understand what it is. There are general queries, transactional ones, for example, “buy.” Price-seeking is “inexpensive,” “cheap,” “price,” if you have such a niche. Do not touch this “Uncategorized.”

You’ve written it all down. You can start with some kind of base, then, if necessary, refine it, layer it, expand it. You can do this yourself according to the categories of your products. You can add brands, or something else like that, depending on what product you are launching.
Script execution results
After running this script, what can we see? For example, hot categories are not hot categories that do something super cool, but categories that are related to the types of queries that may have questions. These are the most popular categories in terms of maximum and minimum.
For example, the brand query “Brand own” has a profitability of 47 for me, the second query has a profitability of 10, uncategorized queries have a profitability of 6.9, and “price-seeking” queries have a profitability of 4.1. Here are examples of these queries. This is just to give you an idea of where the points are and what resources need to be improved. I focus more on the negative aspects.

Category Insights tab
Here you can build some graphs if you need to. Mine are in this format. I made it to suit myself. What I analyze. You can then refine it as you see fit.

I am sharing with you what I have. Here I have three graphs. You see, the script has generated three graphs. What am I looking at in these three graphs? This is for quick superdiagnostics. It’s not for you to build reports or correlations. It’s just to quickly find the infection that’s eating away at your money or the imbalance, for example, profitability, a certain request makes a lot of money, but it receives very little funding, a category of requests or some kind of imbalance.

How many calls and sales will I get by ordering contextual advertising from you?
I need to calculate the conversion of my website Describe
the task
in the application
Calculate potential ad revenue Google
contextual advertising calculator
For example, “Spend and conversions.” What do I want to see here? Here, the conversion rate. The main thing is that I don’t see that I have a lot of spend and few conversions, so that there is no imbalance. The account is not bad here. The only thing is, you see, this middle column, it really has problems, because there are still more spends than conversions. This is the first thing I need to pay attention to, this gift for hore gifts, all these gift sets.

Second, “Spend and conversions value.” Same story. Why do conversion value and conversions show the same thing? Because they are approximately the same, but you may have a very diverse price range for goods, and sometimes the average check shoots up somewhere, the set is very large, so it can stand out against this background.

Here, I can immediately see that “gifts for her” are a very significant resource for me right now. There are a couple of categories on the verge. There are also transactional “buys,” by the way, see? They have a slight dip in conversions here, see, Transactional (buy). But in Conversion value, I have a very large dip.

And Spend vs ROAS is also a moment when we can find brand traffic, of course, it is profitable and should give you a super cool result, right? The main thing for you is that everything is not in the red. That is, there is still the question of profitability, how it will be calculated, whether it is calculated correctly or incorrectly. You see, I have as many as 3.8 “Gifts for her” — the problem with them is very big.
CategorySplit tab
What is it? Here you can also build graphs. Several basic ones are shown here. Here you have a generalized picture of all indicators broken down by the categories you specified. So, use your imagination to decide how many there will be, but don’t overdo it so that you don’t end up with hundreds of them. That’s not the point of this file.

If the previous CategoryInsights quickly shows me CTR, Clicks, and other metrics, you can sit down and dig deeper. I wrote down what I needed for myself. You see, these are basic KPI metrics.
CategorySplit shows everything. And here I can go deeper, so if I don’t click on those indicators according to the graph, I can immediately see the super-profitable and unprofitable categories for myself. 3.3 – Transactional (Buy), for example, Target ROAS. You see, I have problems. For some reason, Transactional with the phrase “buy” has a return on investment for the last 14 days, there is a period here, something is a little tight. You see, there is 4.1. Even price-seeking “price” and “cheap” have a higher return on investment than “buy.” What is our world coming to?
It’s the same story. Look at the costs and ROAS. These are two important points. If I have a ROAS-oriented project, and most projects are ROAS-oriented, then it is important for me that there is no exaggeration. There are a lot of costs for “gifts,” and “gifts” are very bad in terms of profitability. I can see the ratio right away.

You can build a bunch of such graphs. What do you want to see there? Conversion value, other things. I share what I use. I can see the categories right away. Here I looked at them with numbers, and here I can see them visually.
Of course, “Brand own” should always provide high profitability. Friends, this is normal. It would be a problem if it did not provide all these things. Then there would be a very big problem with traffic in general.
PMax_SearchTerms tab
The next tab – just look, you have the campaign ID, campaign name, search query, Match type – this is Performance Max, brand/non-brand, and all the categories you specified. Anything that is not categorized there can be added to the category, expanded, and the list will also be ready. It’s the same story here, everything is checked, even the AOV, the average check.

BrandSplit tab
Does branded traffic spoil my conversion picture? Does it hurt me or does it play a supporting role? In 14 days, I spent only 1,000 UAH on my branded queries. A total of 11 conversions. Yes, they are super profitable. If it weren’t profitable, it would be very strange if branded traffic didn’t convert. Then I would definitely be clicked on, most likely.

And not branded traffic, that is, where the skew goes. Non-branded traffic calls into question the entire profitability, everything is aggregated there. Look at the performance. Why is this necessary? Because there are still situations when there may be a skew in the direction of the same branded traffic, because we are still working with AI, and it is not perfect. If you’ve ever tried to do some deep research or write code with GPT chat, at some point it starts, it’s wrong to say, to degrade, to give some worse, worse result, because we lose connection, it loses. There are all kinds of nuances like that. Here it’s the same story, it’s all the same.

Let’s look at Cost vs Conversion value. Do you see who is generating my revenue? Branded traffic or non-branded traffic? Do you see that I have branded mushy expenses here? Who has a higher Conversion Rate? It’s immediately apparent. Who has a higher ROAS? It’s also apparent. This is a very quick diagnosis for you to understand. This is a larger file for those who are very concerned about their branded campaigns. For example, it makes sense to exclude your own brand because you can be at the top with your own brand. But have you seen the latest Google results, where you might see, for example, Gemini artificial intelligence, then a product, then SEO, then a search, then another product. They’ve made such a mess of it all now. So, should you show up for your brand query? I would show up. Do you need to make sure that the skew in performance results is not at the expense of the brand, that it still finds new conversions? Definitely yes.
NegativeIdeas tab
Here, a priori, there is filtering. They are marked as “Zero conversion.” Costs are set at more than 90 hryvnia. You will have the currency that you have. Here, if necessary, it can be corrected in the script. And ROAS is less than 0.5? 0.5 is very little. It can be raised, and there will be a different number.

But it’s like finding those queries that definitely won’t convert. There may even be branded queries or queries, for example, from Price-seeking, that converted there. Or from transactions with this prefix, or those that are super targeted. I’m looking through it, and there’s a super targeted query here, and it’s in the negatives. This only means that you need to take a look. You see, you can negate it — go ahead and negate it. I don’t see anything wrong with that. You can negate it.
The only thing missing here is the campaign name. This is a detail that probably needs to be finalized for you, but, sorry, all campaigns here have the same traffic, so it’s a minus.
Secondly, you can’t immediately discount everything; you can try, but if anything, a situation may arise where these queries may periodically convert or be part of all these conversions. Therefore, it probably makes sense to select only the most expensive categories, such as the ones I have here in the top, which are quite significant in terms of cost. Although the CTR is cool, their ROAS is practically zero.

Then it makes sense to sit down, search, think about where to segment them, and collect ideas for a list of negative words. But is it necessary to do this on a large scale? You can try. This analysis should be carried out in different categories, at different times, and looked at globally to see if this query really does have negatives week after week, or if it’s just a coincidence that it has a certain number of negatives.
Profitability or expenses can also be slightly improved. These are ideas, not negative words that you need to use. Approach this more consciously. This is not a signal that we are taking a piece and subtracting it. This is still a story where you need to approach it with a little common sense and understand whether it is true or not. And also clarify the categories you wrote down here.


