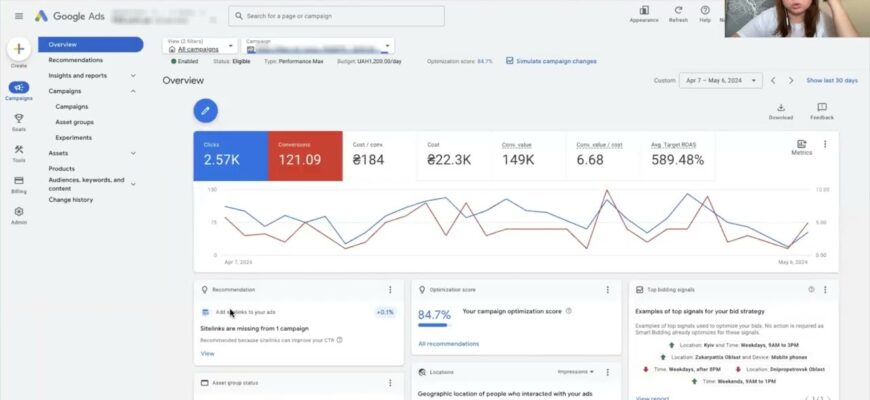
Hello everyone. My name is Yana Lyashenko and I am a Google logistics specialist. I am engaged in delivering business to the target audience with the necessary parameters. And in today’s video we show the team’s case. It’s in about a month, the last month of work.
Brief description of the case
What do we have here? Sales market Ukraine. And we have a theme here, if we could describe it so smoothly, let there be something for photography. Let there be this product for photography. I won’t elaborate on it. Let me remind you once again why I sometimes don’t clarify the nuances well enough because for the product, what kind of product it is. Well, because in principle you don’t have many advertisers in Ukraine and a competent marketer can quite effectively calculate your strategy, test it and make it better. That’s exactly what I would do. That’s why I don’t demonstrate all these nuances here. Let’s do this, even if you came to me, you probably ordered an advertisement and you probably wouldn’t want me to smoke your chips either. Here is a simple explanation why this is so.
Description of project difficulties
Yes, what are the difficulties we have here in this project? I’m not happy enough with this month that I’m showing here, because after all, our cost per conversion should be at least 80 UAH. cheaper. I will now explain why it is not so cheap. There are campaigns in this project that actually do, fit into these target KPIs that the client wants, but these are the options we currently have for resolving this issue.
Average conversion values and “shots” as a result of work
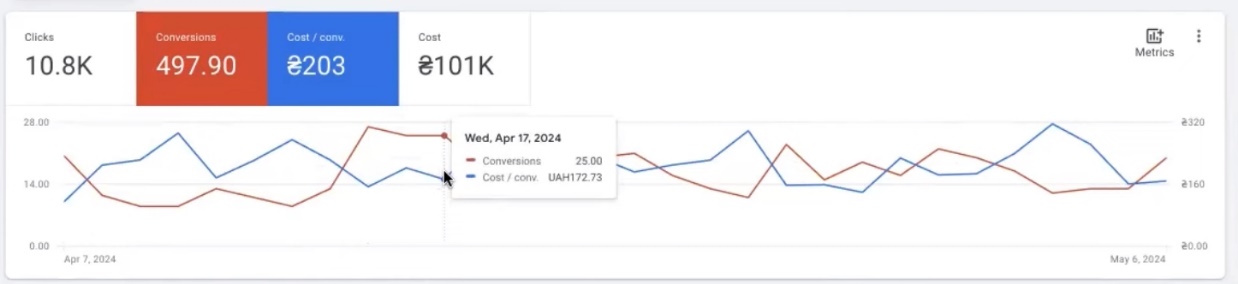
What do we have here? We have an increase in the number of conversions, a kind of “lumbago”, as I call it. I usually have such lumbago in traffic, that’s what I call lumbago. Why? Because you need to do an accurate test to understand whether your star or cash cow products can increase greatly in Converse after you give them more traffic. It’s simple. Because your performance, especially when the cost per conversion does not fit into your desired values, can only lead to a very significant drop in performance.
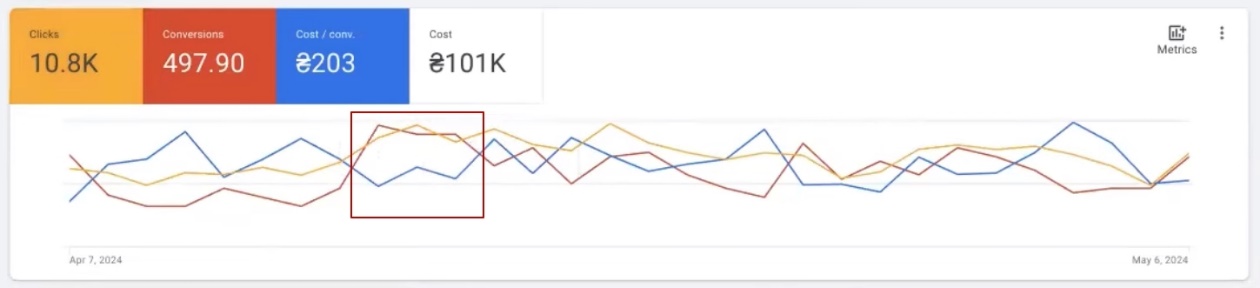
That is, I have a lumbago here. It is very smooth, this is where smooth goes. In terms of pieces, it seems that the client’s desire is almost fulfilled here. This is from 10 conversions. So here, for example, there were 27. Even here we have 22 conversions. That is, a more or less stable standard period. Moreover, if you take, for example, draw even the same graph of average values, for example, conversions. Come on, I’ll even remove the bones to make it brighter for you. That is, if we draw this line now, yes, this is our bottom level. Yes, here is the average conversion value somewhere. In this case, the average conversion value is somewhere around here. Yes, there are deltas here, and in recent negative periods they have been here. They are partially compensated by these small lumbagoes.
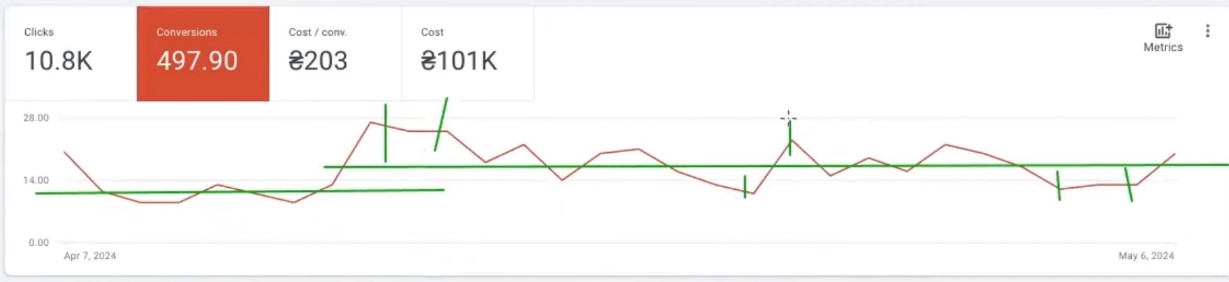
That’s why I say it’s not a super direct cool result. But here it was necessary to reduce this CPA. Therefore, in principle, there are no such significant upward shots. But here in the conversion you can see this piece, which went further after the amount of traffic increased. As you will see here, even the amount of traffic in some periods even decreased. That is, it has become smaller. This is to reduce the cost per conversion.
Performance Max self-learning period
What are these lumbago I’m talking about? Very important, this account is fully optimized and scaled only at performance max. That is, there are no ordinary friends here. Performance Max is a type of advertising campaign that uses the same artificial intelligence in its training. So that you understand and record this, this is an important nuance. The first thing when you create your performances and see this status first is initial training. These are just the first A/B tests conducted by performance. Next, it is already optimized based on the received data analytics in the advertising account and this may generally differ from the signal that you use.
Moreover, it can still focus on the signal after making changes. Well, okay, the first two weeks at most, if there is no catching there, where are your fish, your conversions. He will completely leave this signal from there and generally work in a different direction, in a different direction. It is very easy to check how you track product analysis, what happens in your advertising account in certain periods after making signal changes.
So what do we have here? These shots must be carried out carefully. First you make them small and then see if your number of conversions will increase after these shots. If the “cash cows” or “stars” stop growing.
Categorization of goods according to SWOT analysis
Cash cows, I remind you that according to SWOT analysis we have four product categories of the simplest categorization. These are cash cows – these are products that consistently bring a certain number of conversions per month, consistently for several months. Secondly, as traffic increases, they grow in number. At the same time, your target KPIs for cost or profitability do not move particularly negatively.
There are star products – these are single products that do not reach a certain number of conversions in pieces, a conversion rate, like cash cows do. Plus, when the amount of traffic on them increases, they very often simply sag in their return on investment.
We have “dead dogs”. These are the goods that are spent on us and do not bring us anything. Here I think the simplest and “zeros”.
Nulevki are not just products that received zero impressions. These are still goods, we have a certain quantity relative to other product items. They are always selected individually. If you are interested, come for a consultation, we will analyze your products.
Categorization based on best-selling products
Usually, a popular structure on the Internet is when bestsellers and all other products are launched there. And in such situations, only half of the dozens of accounts can actually grow. The other half doesn’t understand what’s going on with the performance at all. Because both tops and non-tops are very expensive or completely unprofitable. This is because you are defining bestsellers incorrectly. Bestsellers are determined purely technically by indicators, and you need to be able to work with bestsellers. It will not be easier for you to work with zeros or dead dogs – this is the most universal option.
Analysis of the value of conversions after shooting
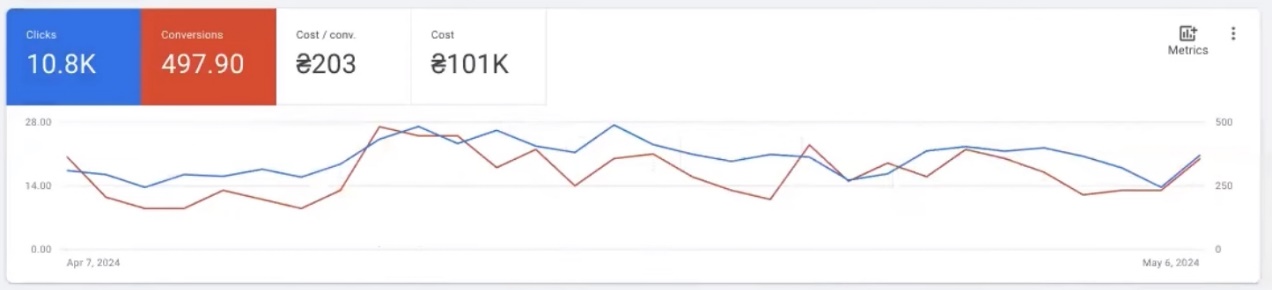
We have such effectiveness after the cross. That is, this is not the first month of working with this advertising account. There is a definite increase in conversions. If the cost per conversion does not drop significantly enough or begins to increase, as we saw here. You see 172 UAH and then again 273 UAH, then accordingly the amount of traffic begins to be cut.
The quality of this traffic should change for the better. All these changes are made as a result of the analysis of where you are in the auction statistics, the quality of your traffic, the equation of product analysis for view_item, add_to_cart and others.
Because what is important here is… Well, that is, this performance lends itself to manual adjustment, not quite of a radically high quality, but it is still present. I will also show you what this cost per conversion of 203 UAH means. What it might be like if we go down to product-by-product analysis and why in some cases it is necessary to cut traffic in order to reduce the cost per conversion.
Analysis of one of the advertising campaigns
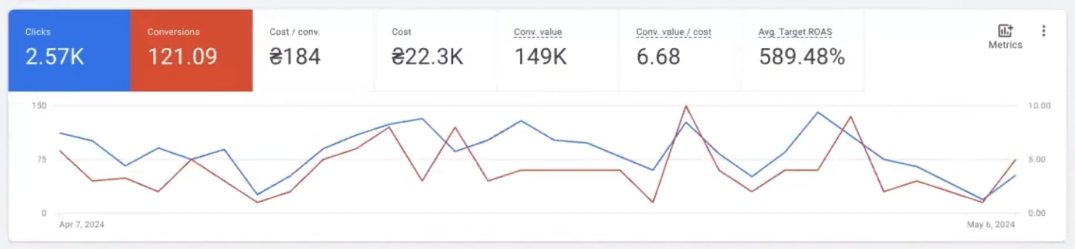
Here I’ll take one. It is the second largest in the number of conversions – this advertising campaign. Here you see, in principle, immediately the effectiveness that follows.
Where do we go next? I want to go to product groups to show a picture. As you can see, I have a Feed only advertising campaign without objects. Yes, we have a certain breakdown here. What do we see here? For example, let’s take the first category by the number of conversions: 178 UAH for this period, the price per conversion was. I unfold it and what can I see here?
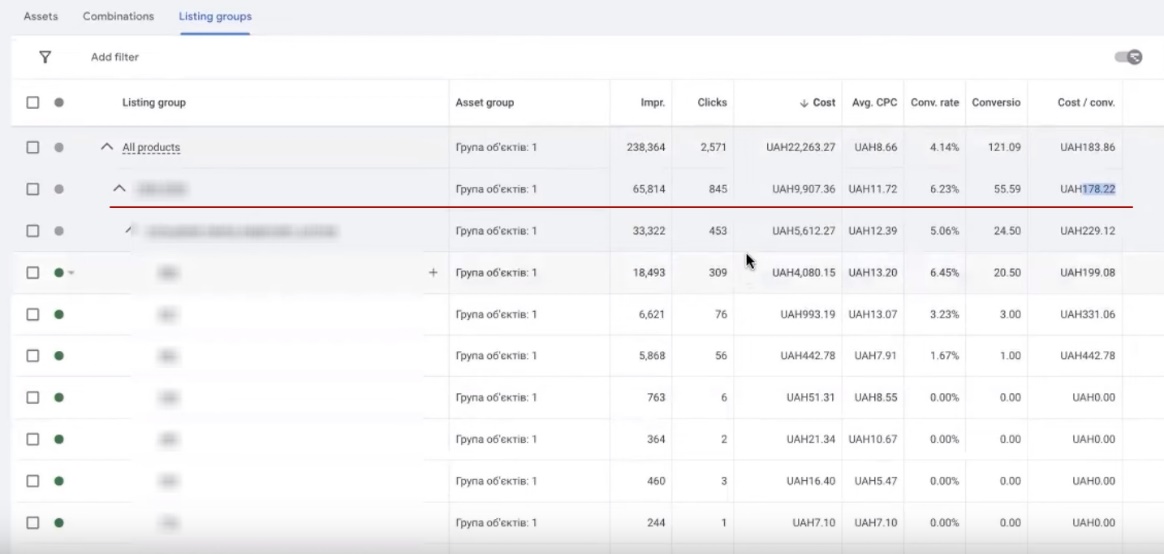
I can see the following picture. For example, there are 18,000 impressions for this specific product item. The conversion rate is pretty cool. 6.45% is not bad. 20 conversions for 199 UAH. In this case, the profitability is usually 8.08%. This suggests that the average check here is simply higher than in other categories.
You can also go to these goods. That is, the high cost, for example, the final cost per conversion can be formed from several parameters. At a minimum, these are products that spent money, brought some results, fit into, or did not fit into, the cost per conversion. There will be items that spent, well, there’s a small amount of money here, but it adds up to the total CPA value.
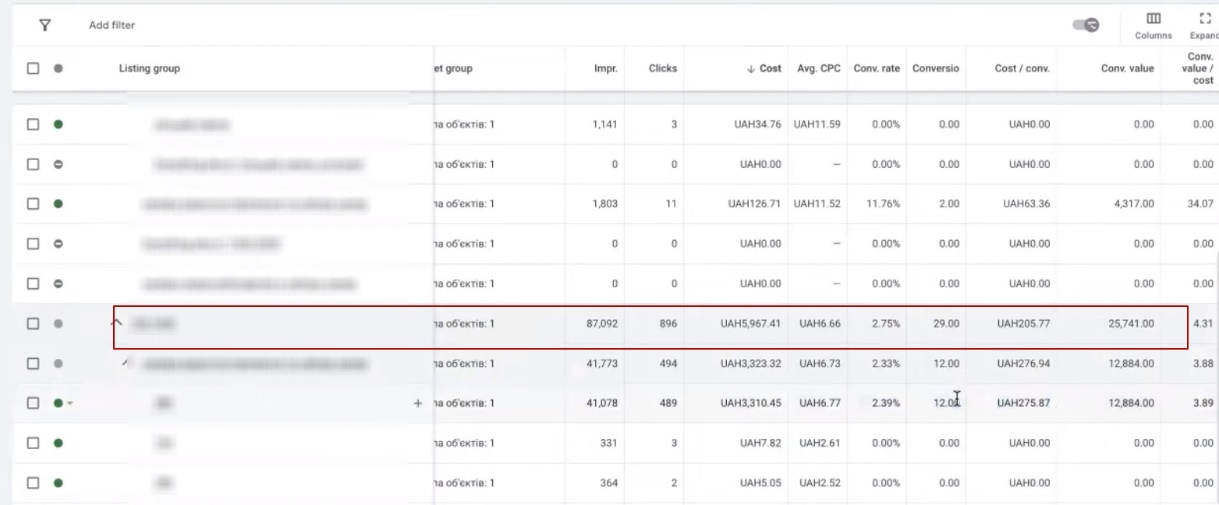
Or for example, what else should I show you? For example, this grouping. Well, for example, also in one product position, priority has been given. There are 12 conversions here. They are quite poor in terms of profitability. 275 UAH price per conversion. you can see, and even at this, the cost per click is quite high and the conversion rate is quite low. This is for a whole month of operation of this product item.
But in general, the cost per conversion, well, for this campaign we can say, well, 183. It is very close to what we need. Well, for example, in the price per conversion, you can even take the same Cost/conversion here. Here is the Cost/conversion. He still became a little, well, even a little better.
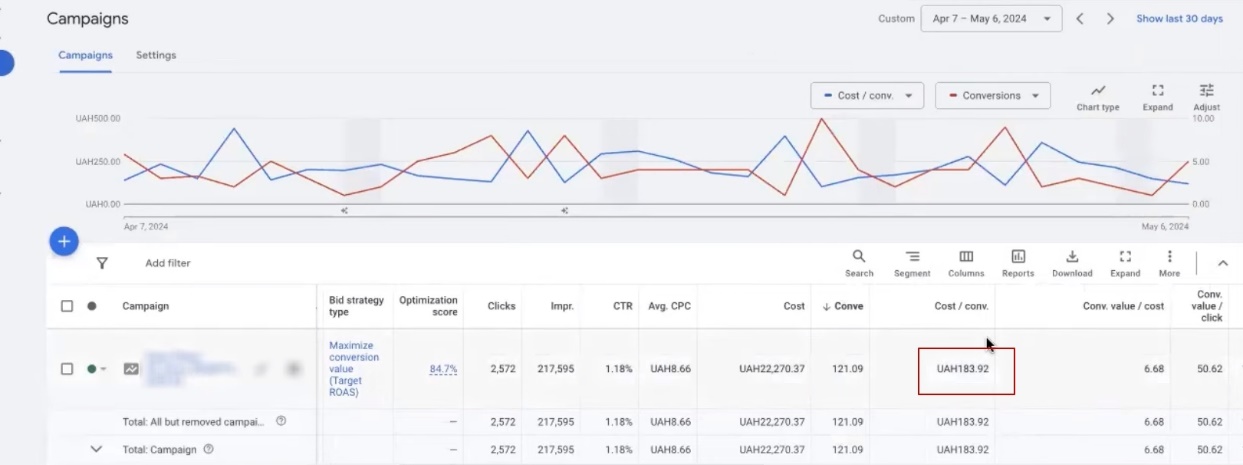
Although this last period is not of sufficient quality, one might say so. That is, if you look at the product level here, and taking into account the restrictions on the daily budget that we have for expenses and we have a large structure of advertising campaigns, then, unlike other cases, the higher cost per conversion is formed not because we have a lot of the same type of product , but because every product item that is either a “cash cow” or something like that is also expensive in terms of cost per conversion. This is already a problematic issue from the point of view of the traffic quality signal selected in the Performance data.
Why performance results change
One of the reasons why it often twitches and changes so much is in these lumbagos, when we increase a certain amount of traffic. Accordingly, in these shootings the performance completely enhances what was previously strong. Strong not from a positive point of view, but maybe even negatively. In terms of the amount of traffic to any product item, it generated more clicks than potential conversions. Or, for example, it generates these clicks for a certain product position, but a completely different position is converted. How to determine this, for example, if you have significantly fewer conversions at the product level than, for example, at the campaign level. This happens often. Or in analytics you can see that you have conversions for already excluded companies. This happens in situations where quite complex attribution work is going on between performances or within a specific performance.
What the client did right
Here is a case. Or is it super positive, super cool in terms of cost per conversion? Definitely not. Is there anything to brag about in terms of conversions? Here it is as an example that it works. What positive did the client do here? He nevertheless trusted and waited for this period while we trained this performance, because in general, most clients have the task of entering in one fell swoop at any cost, getting sales.
Why the low price strategy for a product is not always winning
There is very often a strategy where they greatly reduce the cost per conversion, believing that the product will be sold out super cheaply.
But here it is important to remember that in some niches you will not be able to get a client at the cheapest price. He will still go to call. Plus if it’s, for example, electronics or something electronic, yes, then people usually don’t want to buy the cheapest one. They will most likely accept something in the mid-price range.
Why? Well, because, how can I say, this is psychology. Right? If it’s super cheap, it could be a fake or something of poor quality. Well, why will it be cheaper than others? Right? Therefore, advertising with such products is not due to super low prices. I don’t even see the point why you come out with super low prices, cutting off your margin in order to supposedly get more conversions there. That’s not how it works.
You need to determine, first, don’t kill your niche. Because someone second or third will come in with the same strategy or see it and will lower prices. You will cut your own margin. Secondly, it is very important to remember that, after all, if the more specific your product is, the more it has a specific audience and the lower the KPIs you need, the more you just need to worry about this process of collecting the right analytics in order to continue take a shot and level out the cost per conversion or profitability or whatever target KPIs you need. Because there is artificial intelligence here, the quality of the transmitted data is important to it. This directly affects his work.