Hi everyone, my name is Jana and I’m a Google logistician. I’m in the business of delivering targeted business audiences with the right parameters and scaling sales of businesses around the world using those very AI-ish Google Ads tools.
In today’s video, I will be showing you the team’s case study. By the way, I will show you even the period before and after, so that you take into account even a more or less real picture. I even have incoming calls here, and there are perches separately, so that it would be more beautiful and expedient to describe it all. I want to show with this case study that not everything happens simply due to some randomness, due to seasonality, that there are adequate systematic actions that can be performed in an account, to get to some details and to scale the results in advertising accounts.
The niche of the project, what it was before we started maintenance
If we look, now took a very long period of time from January month, because…. Let’s put it this way, what is the niche? I’m going to name it so as not to scorch the client, his niche, because I can also figure out from the cases who it is, especially if competitors are watching.
Let it be B2B products for holidays of some kind. It is no secret that February 14, March 8, but I do not take March here yet, because here we have monthly analytics and March is not yet finished, and here I have the smallest analytics that can be, it is monthly, so that you can see an objective picture, whether it is the merit of the team’s work or not, taking into account the season and off-season. I’ve also given you the start date.
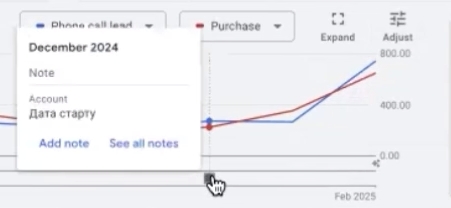
Around December 20, we accepted the project into work, plus a few days of customization, translations, proper conversions, and so on. Somewhere around 25-26, the first clicks came in. That is, we didn’t launch in the coolest period, not in the super season or before the sales. We launched after the main holidays. There may have been something there before the new year, but just so you understand, it’s not super straight early December.
The role of phone calls in the B2B story
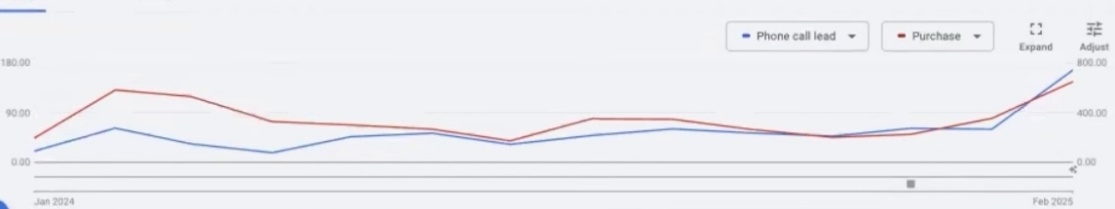
What can I show you from the cool results? That phone calls themselves also play a big role in the B2B story. We are still optimizing for them. We need to get to a certain number of combinations of targets so that we can then switch, for example, to the format of tracking the fact of perchase. But given the delivery formats of New Posts and so on, we are postponing this for now. These are technical issues that do not affect you in any way.
Here we are in the month of January. You can see that Phote call lead is call tracking delivered. Incoming calls are 59.62.
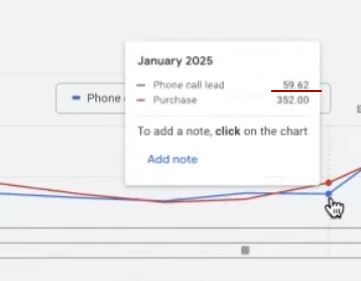
Here we had 352 purchases. By comparison, January of ’24, 20 calls and 192.
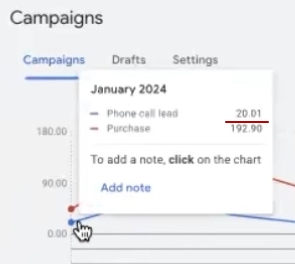
The difference is hard to miss. 352 purchases and 192. And then, of course, February. I might not show super cool super growth here, but given that we started, we have a goal to scale there, to become in this niche, certain leaders, right? We need to do it carefully, not in a pushy way, because when you have a goal to become a leader in a niche, you need to gradually build up that auction value, so that you don’t lead to the kind of trap that the leaders themselves can create, where they overheat the auction and they just raise the bids, the price per click in the auction. And as a consequence, Google in a quarter, in four months can form a new high three-hold bid. What is a three-hold bid? It is the minimum bid, not in general in the auction to go out, but for a given niche, in order to get shows. You can google what a treshold bid is, google google help, there’s that description there, unless they’ve rewritten it of course.
Analysis of February rates
What do we see here? The month of February, when it’s the season, we can go just on the season without taking into account some criteria and so on. By the way, it seems to me that we could have done more in season if the client tried to replenish the account more regularly. Yes, I realize that we get some of the analytics late and it seems that the price per conversion is much more expensive, but in those moments when we need to drive the horses the other way around, you can drive the horses that way, we were a little short on balance. Let’s compare what we have.
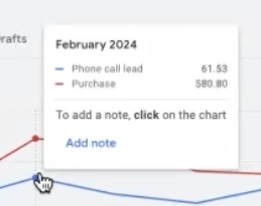
We have leads, 61 phone calls, purchase 580.80. Here was used before fourth analytics, which I’m not a big fan of in terms of scaling or lowering the price per conversion. Plus you have to realize that these hundredths, fractions (they’re actually hidden in the ad account) it’s very hard to calculate the actual number of conversions, actually. We, if we want to scale the account, we have to operate with some numbers. And those numbers don’t always translate into positive feedback.
So we have 580.80. In February 2025, we have 648 and 167 phone call leads. Even if we don’t focus on calls, 648 and 580 doesn’t seem like a lot. But if we analyze by day and we see by IDs, for example, the actual number of conversions, and I’d like to show you the actual number of conversions, and I’d like to show you the number of conversions, there may be significantly fewer full, complete conversions.
Remember, this data-driven attribution model, it doesn’t show you the probability of making a conversion. If you’re going to see 0.3 conversions, 0.5, 0.8, 0.75, 0.05 – that doesn’t mean it’s still finishing up the analytics and there will be a full conversion. No, it’s showing you the percentage impact in that path to conversion of that click on that product itself. That is, how valuable this particular click was in making a conversion. Most likely these 100%, these 20% were, for example, if we see 0.8 attributed to some other channel source. It would seem that Google appropriated them, but no. There’s a lot less of it here in reality. What we can operate on when scaling. There’s a full, nice, round 648. It doesn’t seem to be super many, but it’s a growth format, given that the client has not been very active in replenishing our balance.
Considering that he still has his own set of advertising companies, he has Discovery, he had some CMC, which we do not support, and it also eats up this daily advertising budget. It’s eating up a pretty good chunk of it. Of course, it also provides profitability. We’re not saporting it. But here’s the reason. I think we could have done even more in this case.
What is the reason for the increase in the number of phone call leads?
And the amount of growth, the number of phone call leads is primarily due to the fact that we started to emphasize more – to come in, not to beat just in general, but we started to segment more narrowly. Everything not to scorch the chip. And this allowed to attract more customers to their site, who thus from other advertisers or from offline businesses buy this whole story. I believe that this is a certain version of such an interim evaluation, that really advertising campaigns work quite differently – a little bit of client avatar, a little bit of a completely different client context.
July to February period
If I take, for example, a period a little smaller, I don’t know what period to take here. Let’s take July through this month of February. You can see our startup period right here. A steady growth in calls. It is more visually visible. That is why I have shown you the equalization period since January in order for you to see similar periods, because in fact we have been working since the end of December, January and February. And December is in process. I won’t show March yet, because it’s in the format of a full month picture, so to speak. Right now I’m only filming it for the beginning of the month.
What is the problem with this B2B campaign?
Therefore, at the expense of what all this can be achieved? I’ll be honest, because of the fact that there can be several hundred or even tens of hundreds of variants of the same product, because it’s B2B, different formats, different sizes, and so on, it, of course, complicates the process of optimizing advertising campaigns, because it can be compared, for example, with some unit of clothing or, for example, with some format of the liter of some product, right? It’s probably going to be more convenient with clothing. For example, we sell some pants, and we have a size grid there, from children’s sizes to super-super large sizes of some kind. Of course, when you scroll them in ads, some of them go straight into conversion, some of them don’t. Some customers like one product photo, some like other product photos, that is, some visual design and so on. Of course, this adds complexity to the promotion of this B2B story.
In general for these all niches, this kind of moment is even more convenient than inconvenient – it’s in the fact that everybody is trying to ratchet up the general bombast. When you go into a fairly narrow segmentation, it is that in other niches, if you have seen my cases of home goods, this principle will not work there. The principle is a little bit more generalized there. You can try to segment in the same way as in this format of advertising, but most likely feedback will be much later than in this project. Here is a narrower segmentation on the formats of the structure, which is being worked out here, because in this structure it is difficult to choose the goods that can convert.
Why do I emphasize the goods, because you can just open the editor of those reports and try to select those IDs of goods that are super high-tops, they are super sellers. But those hightops they can just historically they may just have been shown on a regular basis and that’s why they have those conversions. There’s another big block of even variations of these hightops that haven’t been shown at all, but it’s actually the same product in different sizes. Or it could just be different formats of that product. I mean, the variability of those products. And it is necessary to check. It is often the case that even in formats, variants of this product, sometimes there are still hidden certain hightops that you can bet with them, scale your account and grow.
How does artificial intelligence understand customer behavior?
There will be a portion of products that more inbound calls will go to. It’s call tracking, for example. Part of it will go straight into the purchase step. This will also be present. And the challenge here is to try to run a series of these tests on the enumeration of this set of products. Before this scaling format was used through duplication of feeds. That is, there was a main feed for a certain number of products, and this very feed was duplicated, for example. They have different IDs, but the automation understands everything correctly when it sees that the URL is the same, that the behavior is the same. That is, the AI-shka understands it all, it has already gotten used to the fact that people can add formats, variants, that there can be different IDs.
It is not so picky now, unlike the old smart shopping, it treats these product IDs very rigidly, very linearly we go. There is a product that will definitely be converted and we go only in this direction. No, the system now sees all your duplicate feeds as formats of variation of the same product. It does you a kind of bearish favor at the same time, because in fact you have a set of conversions there somehow duplicated, but as practice has shown that January and February – these duplicates do not play that big a role just in very fast scaling. Why? Because in fact your all new AIs on duplicates, not on duplicates, they’re going to use account analytics at launch. Because they don’t have their own personal analytics yet. They can’t turn to themselves and will use the analytics of your account. And in the account, they’ll see what URL, what product format.
If you, of course, you’re passing dynamic remarketing in the right, beautiful with Google business vertical, with ID pin, with value, it’s going to refer to that information, it’s going to see that you had that product spinning, and it’s just in a duplicate fidi try to pass almost the same identical product. Yes, there may be some partial difference, but that’s generally the way it is. On the one hand, you get scaling of the same set of products, but that very same set of products can be percentages of a few. For example, up to 10 percent there. Very rarely have I seen, for example, 30%. Well, unless you have a very small product range, literally up to 50 products, then maybe a higher percentage. Right?
In general, if we take a multi-thousand product assortment, diverse in terms of prices, formats, variants, then, as a rule, somewhere up to a maximum of 10% of the goods that, in principle, make these conversions. All the rest of the goods, it is sometimes shown, it is sometimes clicked, as a result, sometimes converts, but it does not grow into a system. And of course, this is a problem for these B2B projects that you have to work with separately and teach Pmaxes.
The main problem in almost all niches is product categorization
The main problem in almost all niches is to form a backbone of several diverse sets of products, which would be able to compensate for the subsidence of certain other top categories. Usually, it is quite difficult, because we have plus or minus the same niche, it is a little bit easier to do than, for example, if we were selling some formats of promotional equipment, for example, for air filters, for water filters. They’re a little bit different format after all. We don’t have that here, it’s all for holidays. We have a more understandable niche, the customer avatar is more or less understandable. So this is also what I’m describing to you as a complexity format.
Is it possible to make duplicate feeds? Of course you can. But you have to take into account whether you have tested all of your product range, whether all of it has been shown, whether you really understand that you have top product positions, or whether you realize that you have spun off a certain product range, and it is, for example, very expensive, it falls into the category of dead dogs, which wastes money, is very expensive to convert. Or it is there a category, perhaps, generally zero, a product that is not sufficiently unscrewed, not sufficiently shouted out. Accordingly, it may happen that in these, for example, 80% or even 60% of the goods that you have in the tail somehow somehow tilip due to Ai-iki’s thoughts, it may happen that there are even more top product positions, top categories hidden there.
Other factors affecting the results
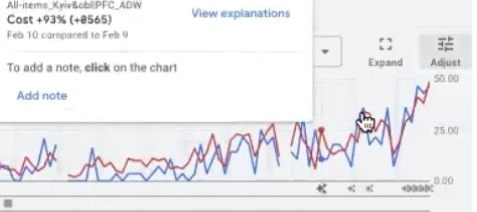
In order to understand it, you just have to test it. Sometimes a business comes in and already knows what it sells super well, what it sells poorly. Sometimes it doesn’t know this because it has only sold a certain set of products all the time, it still has to be tested and found. It’s not like we’re working in a Google Ads simulation, we’re working in a real market with real competitors. Right? Because no one is immune to the fact that tomorrow someone new comes in, who will be very aggressive in some auctions. No one is immune to any changes in the algorithms of Pmax itself. For example, I wrote in my Telegram-channel (if you haven’t subscribed yet – subscribe) I was told by the team that from February 17 to February 19, 25th there was some apparent glitch or some new algorithms, when the references to Google’s own tags very much sagged, although Googlers say that it’s all okay. It’s a planned change. Let’s see if they are changes for better or worse. We can only evaluate them ex post facto for now. There are accounts where that period was super expensive and then Pmax-all recovered on their own. Those who come in for counseling, just yesterday we were sorting through with a client who was like, “Something, something is not right at all.” There was this interval that there was something wrong, and then his Pmaxes all started to recover and gain about the same momentum that they had before.
There are a bunch of different nuances, competitors don’t stand, things can also change for the client, because the fact is, you and I operate with traffic. Our job, for example, our team’s job is to teach the AI thing to pick the right users who are about to be ready to fulfill that order. How do we understand that? How does the system understand it? No matter how much we resent our uniqueness and individuality, we are all the same on the Internet, and it is not very difficult for this big robot, AI-shka, not a robot, even an intellectually advanced progressive robot, to average us somehow and see who among us makes decisions. Of course, the more statistics over a period of time, the AI-shka thinks in 30-day cycles for now. The more analytics, the more targeted it hits your customer avatar. Of course, there are still some widgets.
Should we remove duplicate feeds?
Or did we remove all the duplicate feeds? No, we re-adapted them to our needs with tests of different bid formats, narrow segmentation, and product selection. Sometimes even that’s good enough. You can adapt to everything, because if we were to completely remove these all duplicate feeds for AI-ish, we’d basically break everything that was built before. Our job is to strengthen some aspects of it and let it through to the top, because “you can’t break it, you can’t build it.” You know, like in this philosophical ethical and worldview sentence – “it is easier to put down than to lift someone up on a hill”, it is much harder to lift someone up than to pull him down and put him down. It’s the same story here, to break it all assembled. We tried to analyze it correctly and emphasize it in the right direction.
Reasons that influenced the result of the campaign during the endorsement period
Here the result is visible, obvious. You could say it’s a pretty cool result. Could more have been done here? I believe adequately that more could have been done, but as you can even now see the message, “Balance is running low.”

We have the same problem usually with this account – not enough prompt replenishment. I hope that we do improve that a little bit, because it’s pretty hard to predict how much more we need on the spending side, right? Because we can focus on some aspect of last year, right? But we are already overtaking it here. There are situations where we have a full balance almost at zero, we fall very much, then it all has to be restored, raised.
So yeah – it’s one of these kind of complexities that we usually have in accounts. Is it going to be something bad, change dramatically, break Pmax-and the fact that the client isn’t full ad account? No, we’ve got them all rocked. We’re getting pretty good at driving traffic. The only nuance is that if he doesn’t refill his account, there will be no traffic, there will be no conversions. That’s, you might say, lost revenue, right? Than it’s somehow very dramatically broken Pmaxes. We always try to build a structure that would be more stable than something that is more changeable, where there is some very complex system of leveraged campaigns, where really you make changes, you can dramatically change the direction of the advertising campaigns themselves.
Conclusions
This is the kind of case we wanted to demonstrate. We are still in the process. I think I will shoot a continuation of this case study in a month or two. I would still like to show you this period of time year by year. Here’s March, March. This is how it should be until March. I already want to show a much better period here, so that we will be above these time intervals that are present here. I think we can do it, we can do it, we’ll work on it. I’m done for now.