
Methods of analyzing the effectiveness of contextual advertising depend on several factors, the most significant of which can be attributed to the sphere of activity, the formulated goals, the methodology of converting leads and the tools used.
Why evaluate the effectiveness of contextual advertising?
Before analyzing the effectiveness of the campaign in any way, it is necessary to understand for what purpose such an assessment is carried out at all.
There are several arguments in favor of evaluating the effectiveness of contextual advertising:
- Investments in contextual advertising are primarily the advertiser’s money, which he invests in the display of ads and related support. This money can be multiplied by getting a new channel to attract traffic or modernizing the old one, and you can lose, relying on the help of non-professionals. Only by analyzing the profitability of advertising and return on investment will help to understand whether there is a result from the investment, and if it is not, what is the reason;
- In online marketing you can analyze the behavior of the target audience, get feedback from it and determine how much visitors like the resource, identify their interests. Even in offline business, such information can be extremely useful;
- Being in an information vacuum, without assessing the return on investment in marketing, it is impossible to make adjustments to the strategy. Sometimes this approach leads to unpleasant consequences. Therefore, in order for the RC to be really successful, it is necessary to monitor key indicators;
- The parameters of profitable contextual advertising need to be adjusted repeatedly. To make it optimal from the first time is quite difficult. It is necessary to build hypotheses, experiment and change settings based on the results of the research.
Attention! Evaluation of the results of contextual advertising helps to adjust the quality of service due to the constant analysis of user preferences.
What to consider when analyzing the effectiveness of an advertising campaign?
When analyzing the effectiveness of advertising campaigns it is important to take into account several important points to get reliable results and draw the right conclusions.
Set the right campaign goals
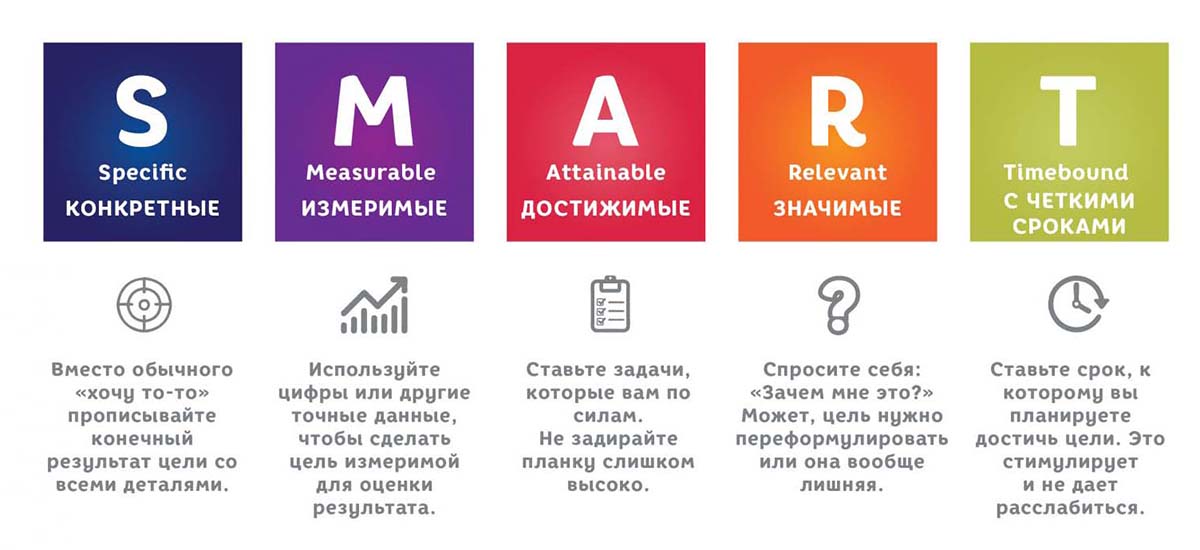
Without clear, specific goals, you’re just shooting blindly, not knowing where you’re aiming or if you’ve hit your target. Marketers often use the SMART system for goal setting. This is an acronym that states that any goal should be:
- Specific. Instead of the vague “increase sales,” state the goal of “get 50 orders from advertising by the end of the month.” The more specific, the better.
- Measurable. When a goal cannot be measured, it is difficult to understand whether it has been achieved. Sales can be counted in units, the total turnover of a company – in hryvnias, and traffic – in the number of visitors. The main thing is that the result should be easily calculable.
- Attainable. You should not set exorbitant goals, especially if the company or product is new on the market. It is better to start with realistic indicators and increase the bar gradually, rather than aim for a million and be quickly disappointed.
- Relevant. The goal should be relevant to the current business objectives. If you have a startup, you should first work on brand recognition, not chasing sales.
- Time-bound. Be sure to set a time frame for accomplishing the goal. This will add motivation to meet the deadline and prevent procrastination.
Here are a couple of good examples of smart goals – “Increase sales of product category X by 15% over the next quarter” and “Increase visits to page X by 10% in a month”.
Armed with the SMART system, you will be able to set the right, measurable goals, as well as clearly see whether you are moving in the right direction and how effective contextual advertising is working. This means that you can optimize your campaigns to get maximum return on investment at minimum cost.
Analyze metrics in a holistic manner
To fully analyze the effectiveness of contextual advertising, it is important to evaluate the indicators as a whole, not separately, in order to see the real picture of how well advertising campaigns work.
Let’s say that the CTR for a certain ad is above average. This is great – it means that the creative hooks users and attracts the target audience. However, when users click through this ad to the site, they do not order goods, but simply close the page. As a result, high CTR loses its meaning, and you just waste your budget.
Keep testing different variants of ads, optimize the landing page or direct traffic to another, more relevant section of the site. The goal is to drive users to conversion, not just get more clicks.
Compare performance over the same periods
If there were many holidays and weekends in one period and regular working days in another, the effectiveness of advertising campaigns will be significantly different when comparing between them. It is better to compare week to week, and year to year. This will give more reliable information about the dynamics of advertising effectiveness.
Track the dynamics
The right approach is to fix the values of key metrics before launching an advertising campaign, and afterwards regularly take down the indicators and analyze the changes. Only in this way will you be able to see the real effect of your advertising efforts and make the necessary adjustments in time.
Let’s say you launched a campaign and a week later received 20 orders. But that doesn’t tell us anything, because we don’t know how many there were before the ad was launched. And even if the results have grown a lot, you may not notice it if you have not fixed the initial values. So don’t forget to monitor the dynamics on an ongoing basis.
Take seasonality into account
If your business is subject to seasonal fluctuations, comparing high season performance to low season performance is meaningless. It’s like comparing apples to oranges. It is better to focus on similar periods of past years. Compare the summer months of this year with the summer months of last year.
The more data, the better
Try to collect at least a thousand targeted actions (leads, sales) after the campaign launch before making serious conclusions and assigning KPIs. A small sample can give a skewed result, so be patient and save statistics.
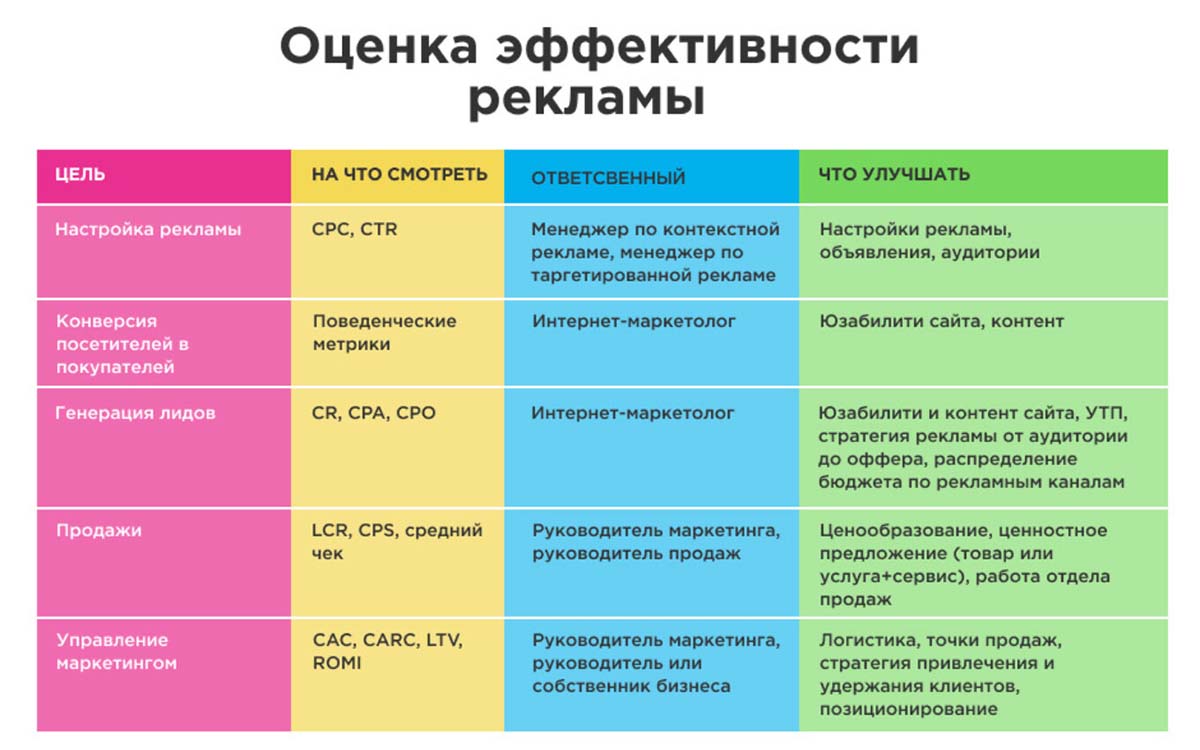
Key performance indicators of contextual advertising
There are two groups of contextual advertising performance indicators: marketing and financial. The values of the parameters of the first group can be tracked in the Google Ads service account or in the Analytics cabinet. To analyze the financial component, information that is most often found in a corporate CRM system or accounting program is used.
Important! Only a comprehensive comparison of various metrics allows you to get a true picture of the effectiveness of the advertising campaign.
If you take into account only marketing indicators, such as conversion growth, it will not allow you to conclude that from a financial point of view the effect of the advertising activity is also on top. Financial criteria such as ROI and LTV are designed to solve this problem.
Such evaluation will allow not only to customize ads, but also to adjust business processes in accordance with the audience’s demands with minimal costs.
How to evaluate marketing performance indicators?
To analyze the marketing component of the effectiveness of advertising investments, it is advisable to work with five basic metrics. Two of them are coefficients and are expressed in percentages: CTR and CR. The other criteria are cost estimates: CPC, CPA and CPL.
CTR (Click Through Rate)

Click Through Rate is used to understand what proportion of ad impressions causes a user to click on a link. CTR equal to 7% indicates that 7 out of 100 ad impressions end with a click through to the site.
The Google Ads system receives remuneration not for displays, but for each user click. Consequently, ads with a high CTR are the most profitable for it. Therefore, for such campaigns the system offers to reduce the cost per click.
Help! There is no optimal value of clickability ratio. You need to monitor its dynamics, and if the CTR is growing, then the strategy is built correctly.
When answering the question of what the CTR should be, the theme of the resource, the industry of the business and many other factors play a role. Somewhere you can applaud the result of 2.5%, and in some areas even 20% is not considered sufficient. It can be unequivocally said that the more clicks an ad gets, the better.
CR (conversion rate)

One of the defining performance indicators is the conversion rate. CR (Conversion Rate) determines how many users who went to the site completed an application or other targeted action.
Tip! It is convenient to analyze conversion and other metrics using Google Analytics tools.
CR illustrates how well the ad is composed and customized. If its content meets the user’s needs and the landing page answers most of their questions, the conversion rate will be quite high. If, for example, the price tag or the quality of the product offered is not relevant to the majority, the CR will be low.
CPC (cost per click)

Average cost per click is abbreviated as CPC. This is a dynamic parameter and at different points in time it can differ several times depending on the competition.
Important! CPC should not be used as a criterion for assessing the quality of an ad.
When the average price per click decreases, the effectiveness of the advertising campaign most often suffers. The flow of visitors to the advertiser’s site decreases.
CPA (cost per action)

To understand how much it costs to fill out a form, questionnaire, registration or application from a user, the CPA cost indicator is used. It shows how much it cost a predetermined event that should occur after attracting a potential customer to the site. So, for example, with an advertising budget of $100 the Internet portal was visited by 25 new users and only 10 of them left an application. CPA in this case will be equal to $10.
CPL (cost per lead)

Cost per user contact or CPL is calculated as the ratio of the advertising budget to the number of leads received. For example, during a campaign with a total ad spend of $500, 100 people filled out a feedback form and 250 new visitors came in total. CPL in this case will be $5.
CPM (price per thousand impressions)
If your goal is to reach the widest possible audience and make your brand more recognizable, CPM is the parameter you should pay attention to. Cost per Mille will help you analyze the effectiveness of advertising in a contextual media network.
To calculate this indicator, divide the amount of investment in advertising for a certain period by the number of ad impressions for the same time, and then multiply the result by 1000.
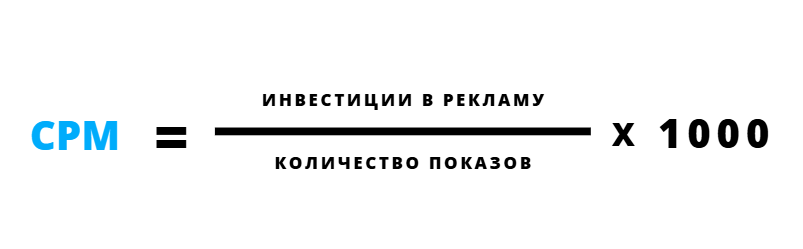
Let’s assume that you invested 10000 hryvnias in an advertising campaign, and the ads were shown 20000 times. So CPM will be equal to (10000 ÷ 20000) * 1000 = 500. It turns out that for one thousand ad impressions you will pay 500 hryvnias.
But it is not enough just to track CPM – be sure to look at it in conjunction with CTR. High clickability indicates that your ad is relevant and arouses interest in the audience. This means that the money for displays is not wasted.
And if the CTR is low, it’s time to work on the ad itself. Experiment with creativity, calls to action, colors and graphics. Look for something that will hook your audience and encourage them to click on the link. Even small changes can have a tangible effect.
CPI (Cost Per Install)
Cost per Install is the most important metric for advertisers promoting mobile apps. In essence, CPI is a type of CPA (price per action), where the target action is the installation of a mobile app on a smartphone.

To calculate CPI, divide the total amount that is allocated to promote the application for the required period by the number of installations for the same time.

For example, 75000 hryvnias were spent on promoting the application and 1000 installations were received. So CPI is 75000 ÷ 1000 = 75. That is, each application installation cost you 75 hryvnias.
Working with CPI is relevant if you already know exactly how much you are willing to pay per installation to make it profitable. If you are just starting to promote a mobile application, it is better to test other payment models – for example, for clicks or displays, collect statistics and analyze the results. And then, with the figures in hand, switch to CPI.
Assessing the financial performance of the RC
The economic effect of RC can be assessed by quantitative and cost metrics that everyone can understand. For this purpose, they often analyze the number of new customers or completed transactions, the dynamics of changes in the average check, profit, sales volumes.
Attention! When analyzing financial performance, you will need access to sales data.
But more complex and financially important factors should be considered: ROI, cost of acquiring a new customer, and total revenue over time.
ROI (return on investment)

For managers or owners of companies, the most important indicator is the ROI or return on investment in advertising. The value of this parameter allows you to assess the degree of profitability of contextual advertising and is calculated as the ratio of income reduced by the amount of investment to the total amount of investment.
For example, if a company invested $100 in marketing and received income of $175, ROI is calculated as ($175-$100)/$100=75%.
The value of ROI depends not only on the professionalism of PPC-specialists, but also on quite objective factors: business sphere and market conditions. Therefore, it is necessary to evaluate not only the nominal value of the indicator, but also the dynamics of its change.
ROAS (return on marketing investment ratio)
Return on Ad Spend is the most important metric for evaluating the effectiveness of investments in contextual advertising. It will help you find out how much money each hryvnia invested in promotion has brought.
To calculate ROAS, divide the total profit from the advertising campaign by the expenses for a single time period and multiply by 100%.

Let’s assume that your online store earned 300000 hryvnias, while you spent 100000 on advertising. Let’s calculate – 300000 ÷ 100000 * 100% = 300%. As a result, each invested hryvnia returned to your wallet and brought with it two more.
ROAS can be counted for a campaign, a group of ads or specific search queries. This helps to identify the most profitable and unprofitable areas.
If ROAS is less than 100%, you are working in the negative. With ROAS equal to 100%, advertising pays for itself, but does not bring profit. A value above 100% indicates that the campaign is profitable and can be scaled.
Which indicator should be considered good? There is no universal answer – it all depends on your niche, product margins, and competition. On average, ROAS of 200-300% is already considered a decent result.
CAC (cost of attracting a new client)

The customer acquisition cost CAC shows how much you have to spend to attract one customer. The formula is simple. The amount of money invested in advertising should be divided by the number of new clients who came through it. So, if a budget of $500 resulted in 50 hits, CAC equals $10.
Important! The CAC indicator should be evaluated in dynamics. And a decrease in its value indicates an increase in performance.
LTV (total profit for the time of cooperation with the client)
Often, the cost of engagement indicator at first glance seems too high and may cause a negative profit on a single transaction. But if you evaluate the total profitability over the period of cooperation with the buyer LTV (LifeTime Value), the situation may not be so negative.
A simple formula for calculating LTV looks like this: the amount of total profit for a long period of time should be divided by the number of people who bought the product or ordered the service.
LTV can be determined in different ways. The simplest is to divide the company’s total profit by the number of customers.
More accurate figures are obtained if you know the average period of contact between the customer and the company, the number of transactions made during this period, and the average amount of one transaction.
Example: how to calculate the effectiveness of contextual advertising?
To calculate the effectiveness of contextual advertising, it is necessary to determine the conversion rate and the average profit per transaction. If these parameters are known, then the maximum click price can be calculated using the following algorithm. For example, let’s set the conversion rate at 4%, and the average margin per sale – $50.
- In order to make one sale, you need to attract 25 visitors to the site (=1/0.04);
- With an average profit from the sale of $50 can spend no more than $50 to attract one customer. Excess of advertising costs over the size of the average profit from one transaction invariably leads to the loss of this transaction. On one visit can spend no more than $50/25=$2;
- Having made a reverse check, we make sure: attracting 25 visitors with the cost of a click $2 is equal to one who made an order, at a price of $2*25=$50;
- The calculations are correct if the main thing when attracting a new client is not to go into the minus. If the rate of profit from each transaction is determined, then the margin from the sale should be adjusted with this information;
- After determining the maximum click price, it is necessary to evaluate the actual possibility of extracting traffic to the site from Google Ads at this cost.