Hello everyone. My name is Yana Lyashenko, I am a Google logistician. My job is to deliver target audiences with the right characteristics to businesses and help scale online sales through Google Ads tools. Today I will analyze one of our team’s case studies.
Brief case description
Market — Italy. Currency — don’t be alarmed if you haven’t encountered it before — Czech koruna. What are we selling? To simplify — handmade children’s products. These aren’t toys in the conventional sense, rather something closer to furniture and related categories.
Project challenges
Why am I showing this particular case? Because it features a whole bouquet of difficulties.
The first and most painful — the Shopify platform. It has chronic problems with accurate conversion tracking. The sales figures we see in the ad account — that’s far from everything. In reality, there are noticeably more conversions.
We tried numerous options: connected different plugins, built alternative tracking schemes, experimented with UTM tags and various tracking formats. The result is the same — Shopify, especially when paying through Shopify Payments, consistently undercounts some conversions.
We repeatedly contacted Shopify support to verify our hypothesis. And each time received roughly the same response: “Yes, the problem has existed for a long time, we are working on fixing it.” I might attach a screenshot of one of these correspondences here — the essence of the responses doesn’t change from request to request.
So the only conversion we see here is the purchase. And its actual quantity is significantly higher than what analytics shows. Which means the actual cost per conversion is much lower than what’s displayed in the account.
Work on maximizing analytics collection
I will work with the numbers we have. The Italian market in terms of conversion volume was very sluggish. Different campaign structures we tested — also yielded results with difficulty. But we still managed to accumulate sufficient analytics volume to build upon for further scaling.
Why are conversion tracking disruptions such a critical problem specifically for Performance Max? Because performance campaigns don’t receive the data volume they should rely on for learning. Simply put, the algorithm “sees” fewer purchases than actually occurred, and makes decisions based on an incomplete picture.
What did we do? We stuffed the account with additional dynamic remarketing data feeds. We set these conversions to “additional tracking” mode — not as primary optimization goals, but so the system could at least indirectly understand what happens after a click.
Is this ideal? No. The ideal situation is when the algorithm sees the complete user journey from first touch with the product to purchase. But we work with what we have. And this is the main difficulty of the project.
Product categorization based on collected analytics
Once analytics accumulated, the niche revealed a classic product role division. I use the BCG matrix analogy — I think many are familiar with it.
So-called “cash cows” appeared — products that consistently generate conversions. Traffic can be gradually increased on them, though they don’t grow at explosive rates. There are “stars” — products with potential, but without regular sales yet. There are “dogs” — but in this project we didn’t turn them off or write them off.
Instead, we tried to move them to the “stars” category, training performance campaigns to generate a certain type of traffic for them. And finally, there are “zero” products — those that receive minimal impressions compared to the rest of the assortment or don’t receive them at all. This is a hidden growth resource.
A separate story — “wandering” products that sometimes fall into zeros, sometimes emerge from them. Because situations where in a new performance campaign with spun-up zeros all products suddenly start showing evenly — such things don’t happen. And if they did — it would increase the cost per conversion.
Spikes as a result of collected analytics
So, analytics is collected. Next we move to what I call “spikes.” This is when we pointedly try to increase budgets — on individual campaigns or massively across a whole set of campaigns. The structure here is quite substantial, and the goal of spikes is to test several hypotheses:
- Will “cash cows” proportionally increase the number of conversions in units when budget increases?
- Will new “stars” appear — that is, will performance campaigns generate conversions on products that previously sold sporadically?
- Will results fit within the critical KPIs set by the client?
Clarification: I consider “stars” to be products with irregular conversions — anything below 15 sales per month.
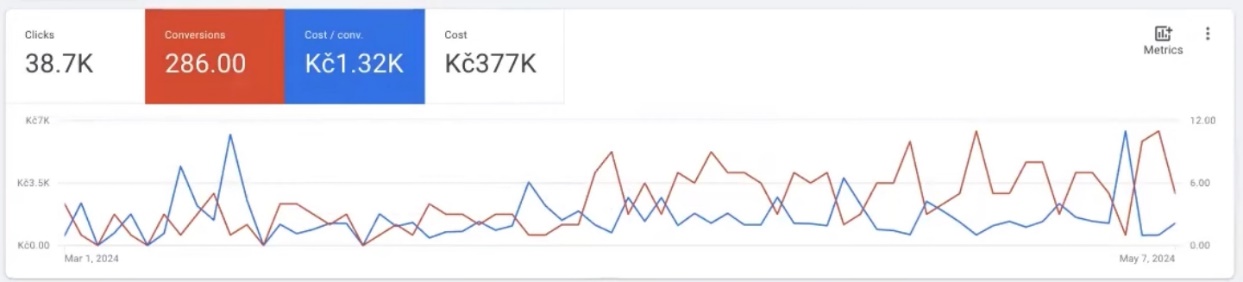
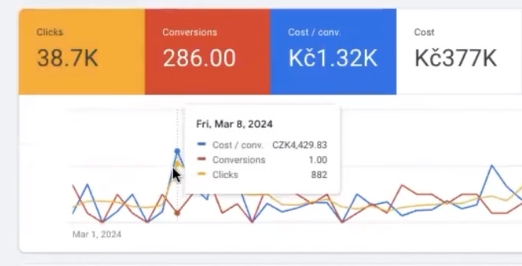
The graph clearly shows the spike moment — sharp budget increase. Then it was reduced back. Meanwhile conversions remained more or less stable. Somewhere the cost per conversion spiked — but this is explainable: the performance campaign still doesn’t see the complete sales picture.
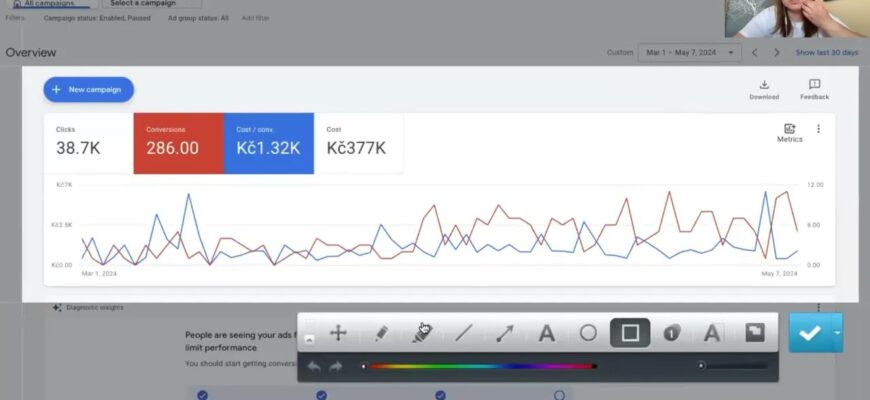
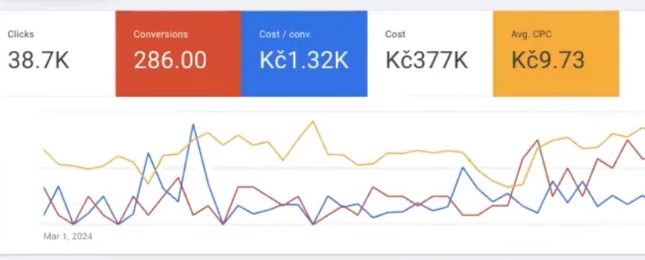
Overall, I’m relatively satisfied with this period’s results. Yes, the screenshot from the ad account looks alarming: few sales, expensive costs per conversion, huge expense figure with only a single conversion (though clicks — decent). But in the Shopify admin, conversions were present. And if we correlate them with expenses — the project was approximately at the break-even point. Not in the red, but not at that tangible plus the client was counting on.
Now I’ll show this same picture in a slightly different format. I like to examine any performance campaigns specifically in dynamics — this way the real picture is visible.
Analysis of performance campaigns in dynamics by average values
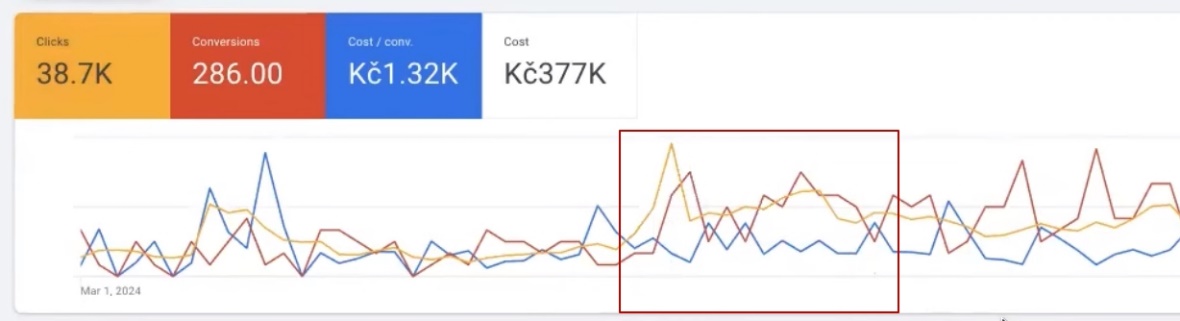
For clarity, I remove clicks and look at the picture specifically by conversions. We take a certain time period and measure the average value.
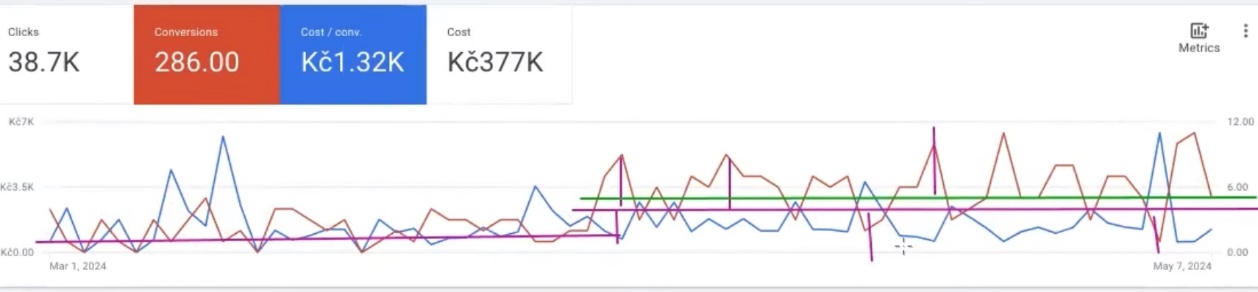
In the first period, the average number of conversions held at one level. In the second period, this average is already noticeably higher. The growth delta is substantial. And what’s even more important: if you look closely at fluctuations around the average line of the second period, the “spikes” upward in conversion units noticeably exceed the dips downward. This is a good indicator.
Even if we slightly adjust the average line, shift it a bit lower — the overall pattern remains. Downward breaches remain significantly smaller than upward breaches. For me, this is a sufficiently positive signal: the traffic that Performance Max generates is quality overall. Which means the performance campaign’s learning mechanics, audience selection, and the system’s internal A/B tests are working in the right direction.
Why is it important to pay attention to attribution?
The only thing that periodically spoils the picture — cost per conversion spikes. And here we need to understand what they depend on. Two key factors: attribution model and buyer behavioral patterns. Let me break this down with specific numbers.
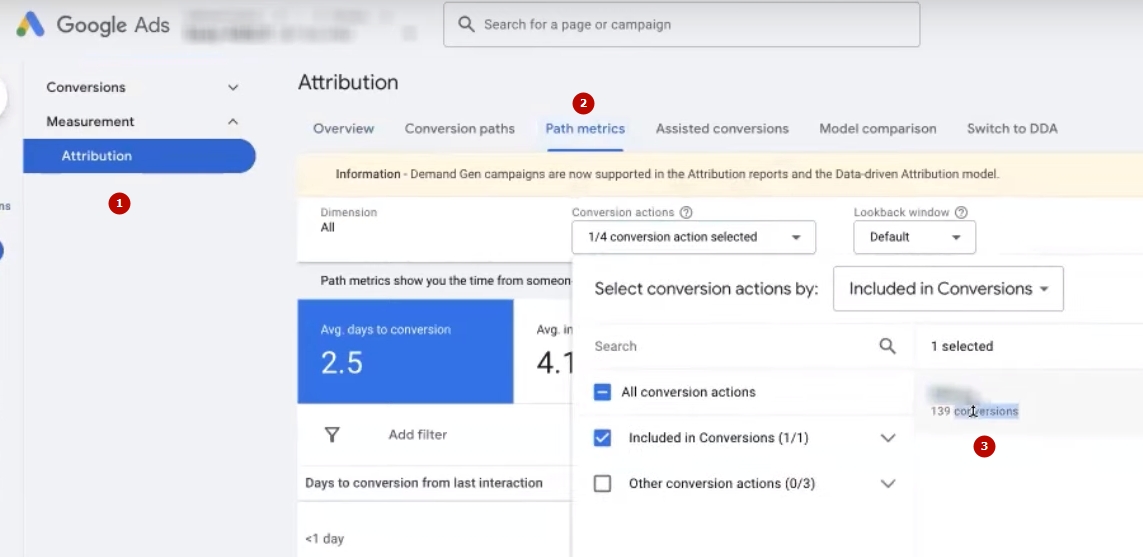
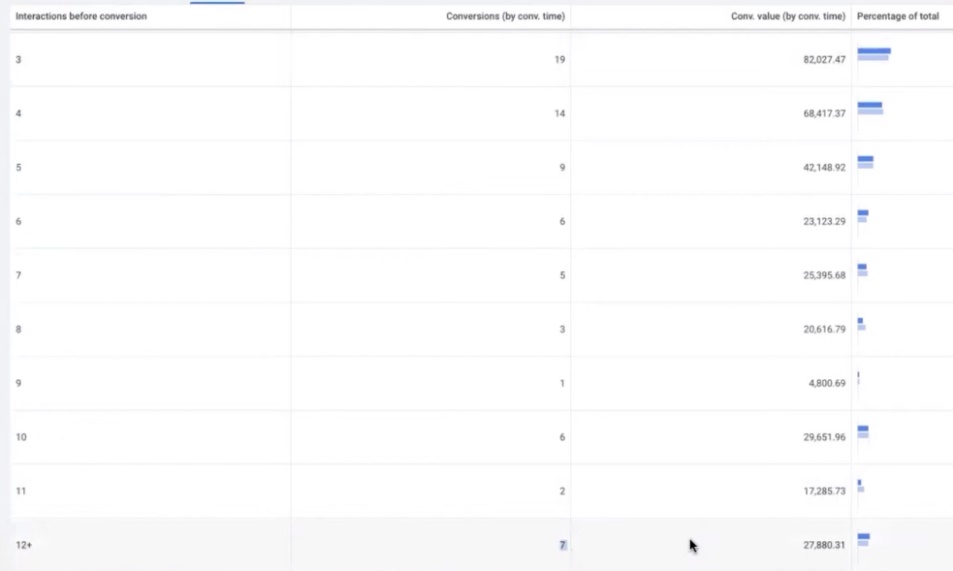
We go to the “Paths to conversion” report. Selected conversion — purchase, the only one we track. And here’s what we see — the most critical metric directly affecting cost per conversion: the average number of interactions before purchase is 4.1. That is, before an Italian buyer places an order, they click on our ad an average of four times. Some fewer, and some manage to click all 12 times before deciding. And these 12-click users also contribute to earnings.
Important point: this analytics is built only on those who ultimately bought. We cannot target exclusively people who buy on the first click. We target those who want to buy the product, but before that take aim — compare prices, study delivery terms, choose colors, check competitors. And this is without accounting for the return rate, which is traditionally high in Italy.
Now let’s add the average cost per click (avg. CPC) here — it’s almost 10 Czech koruna. Calculating: minimum 4 clicks at 10 koruna — that’s 40 koruna just for one conversion to happen. And this is the average value; it can be both cheaper and more expensive. Performance Max adaptively adjusts to those users who ultimately buy, but it has little room for maneuver.
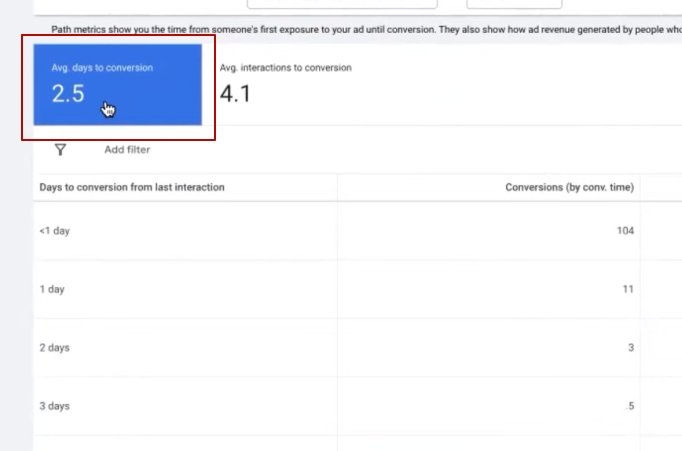
The situation is further complicated by the average number of days to conversion — 2.5 days. This is the time it takes a person to make a purchase decision. Moreover, we had to specifically increase the conversion window for Italy: when it was set to 1.2 days, fewer conversions were recorded. Expanded the window — and the picture improved.
If we look at purchases in Google Analytics, the numbers there are significantly more modest than for the main conversion — again, data transmission disruptions. And there the decision-making period can reach up to 8 days, because data collection follows different logic.
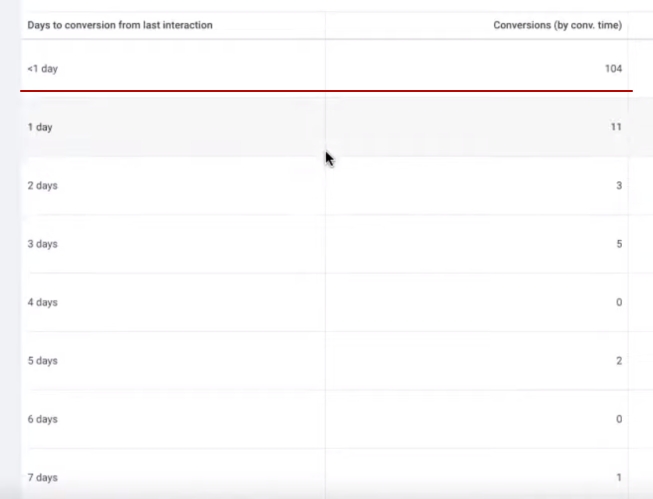
For scale: 104 conversions occurred within the first 24 hours after click, and 9 conversions — after more than 12 days. I usually analyze a 30-day window, though I consider 7 days ideal. But analytics is rarely complete within a week — you’ll see the real number of conversions for yesterday only after 72 hours. Google recalculates, corrects, supplements data.
This is how Italians buy children’s products — thoughtfully, with multiple visits and comparisons. This isn’t a problem in the conventional sense, but rather a complex task that most projects in similar niches face. Pouring in a large budget and getting at least some conversions — not difficult.
But bringing a Performance Max campaign to a state where increased clicks proportionally yield conversion growth — that’s already a task with an asterisk. Completely eliminating the long decision-making cycle is unrealistic, but we need to account for this and adjust strategy. Remember this nuance — it’s key.
Some peculiarities of Google Ads setup
There are situations when everything comes together perfectly: high demand for the product, moderate competition in the niche, a “hot” buyer ready to place an order right now. Under such conditions, even poorly configured Google Ads will start bringing sales. You’ll be satisfied with the result — until you hit a certain budget ceiling. Once you reach it — profitability will start declining.
But if there are difficulties and nuances in the purchase process — long decision cycle, buyer compares, returns — simply increasing budget is pointless. Expenses will grow, profitability will drop to zero, and you won’t get tangible results.
What does this look like in practice? Recall the first spike I mentioned above — the traffic increase that led to noticeable conversion growth. If you look closely, the click volume was roughly at the same level. But as soon as we sharply raised the budget — expenses skyrocketed, cost per conversion went through the roof, and profitability collapsed. And you stand at a dead end, not understanding what to do next.
Therefore, it’s critically important to control the analytics you “feed” your ad account. Performance Max has built-in artificial intelligence that learns specifically on the data you provide it. What data you give — such conclusions it will draw.
Peculiarities of artificial intelligence results in performance campaigns
For AI in performance campaigns to be able to independently pull out of any critical situations — dips, cost per conversion spikes, volume drops — it needs a minimum of 50 conversions per week. Exactly 50 real sales, not micro-conversions. In our case, we haven’t reached this threshold yet, though perhaps over time we’ll get to 50 sales per day.
For European markets, including Italy, there’s an additional complication — Consent Mode. This is a mechanism for collecting consent to use cookies. The system requires that at least a thousand users who denied cookie access and a thousand who gave consent accumulate within 7 days.
Only then does machine learning kick into full gear and can pull out of critical situations: smooth out dips, stabilize conversions, make the picture more even and predictable.
Conclusions
You can’t just pump a thousand or two thousand events into an account that carry no real value. Google will earn anyway — you pay for every click. But whether you will earn — that’s a big question.
There are projects and niches where you need to be patient during performance campaign optimization. Launching a mass of tests simultaneously right after start — is risky. They can blur the real portrait of the customer that the performance campaign has almost found. Making sharp and frequent budget spikes is also impossible.
Look at how we acted: after the first spike, we brought the budget back down, brought the picture to an understandable state, analyzed — and only then made the next one. And this isn’t mechanical “copied campaign — pasted — changed signal.” Behind each such decision stands a large block of intellectual work: constant campaign analysis, data interpretation, consequence calculation.
I wanted to demonstrate a complex and interesting case to you — I hope it worked out. See you in new cases and episodes!