On July 1, 2023, Google officially switched from Universal Analytics to GA 4 (which first saw the light of day back in 2020). And if the differences between the second and third versions of the tool were purely cosmetic, the appearance of Google Analytics 4 is simply a fundamental shift in the approach to data collection and subsequent analysis.
The modernized version of the analytical system presents a fundamentally changed architecture based on a different approach to data collection, which allows you to get more accurate statistics. Also, its appearance is designed to make life much easier for web developers and marketers.
Next we will try to understand the differences between Universal Analytics and Google Analytics 4 and how they will affect the work with the tool.
What is the difference between Universal Analytics and Google Analytics 4?
These two products have significant differences both in terms of design and the set of available functions. But the cardinal difference lies precisely in the model of information acquisition. Let’s look at the main aspects of the difference between Universal Analytics and Google Analytics 4.
Method of information collection
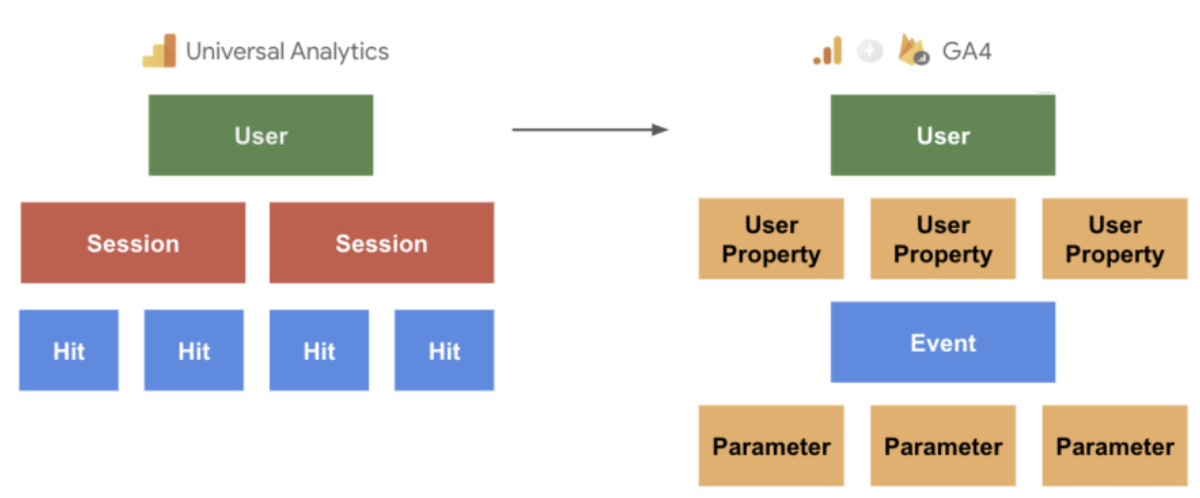
The main difference lies in the method of obtaining the data. The old method, which has remained practically unchanged since the beginning of the 21st century, is based on tracking sessions and web page views. The whole system of the tool’s work is built around this, reporting is created and visitors’ actions are recorded.
But today this approach has lost its effectiveness for several reasons:
- In addition to the usual websites, users use applications every day, in which they also need to record activity.
- A user today can have several devices (2 smartphones, tablet, PC, laptop, Smart TV) and interact with a brand from each of them.
Fourth Analytics takes a fundamentally different approach. Instead of sessions, events are logged. This makes it possible to track behavioral factors without the need to connect third-party analytical systems. The method allows you to get more information and works more accurately.
Events in Google Analytics 4 come in three types:
- Automatic. Capture key user actions (views, scrolling, clicking on an element, first visit, session start, etc.). They give a general idea of behavior on the site or in the application and start to be collected instantly after the GA4 code is installed.
- Recommended. Their set depends on the type of business and the goals of its owner. This includes buying, logging in, registering, viewing a product, adding to cart, etc. These are already predefined in the system, but they need to be enabled separately. They help you track everything related to conversions and monetization.
- Custom. This includes more “exclusive” events that are not covered by the previous two types. For example, this could be submitting a form, watching a video, sharing on social networks, etc. Up to 500 custom events can be created in one data stream.
Each event, regardless of its type, can have parameters associated with it. This is additional data that provides more detailed information about a particular event. For example, for a purchase, you can track the transaction ID, cost, currency, etc. The detailed principle of operation is shown in the diagram:
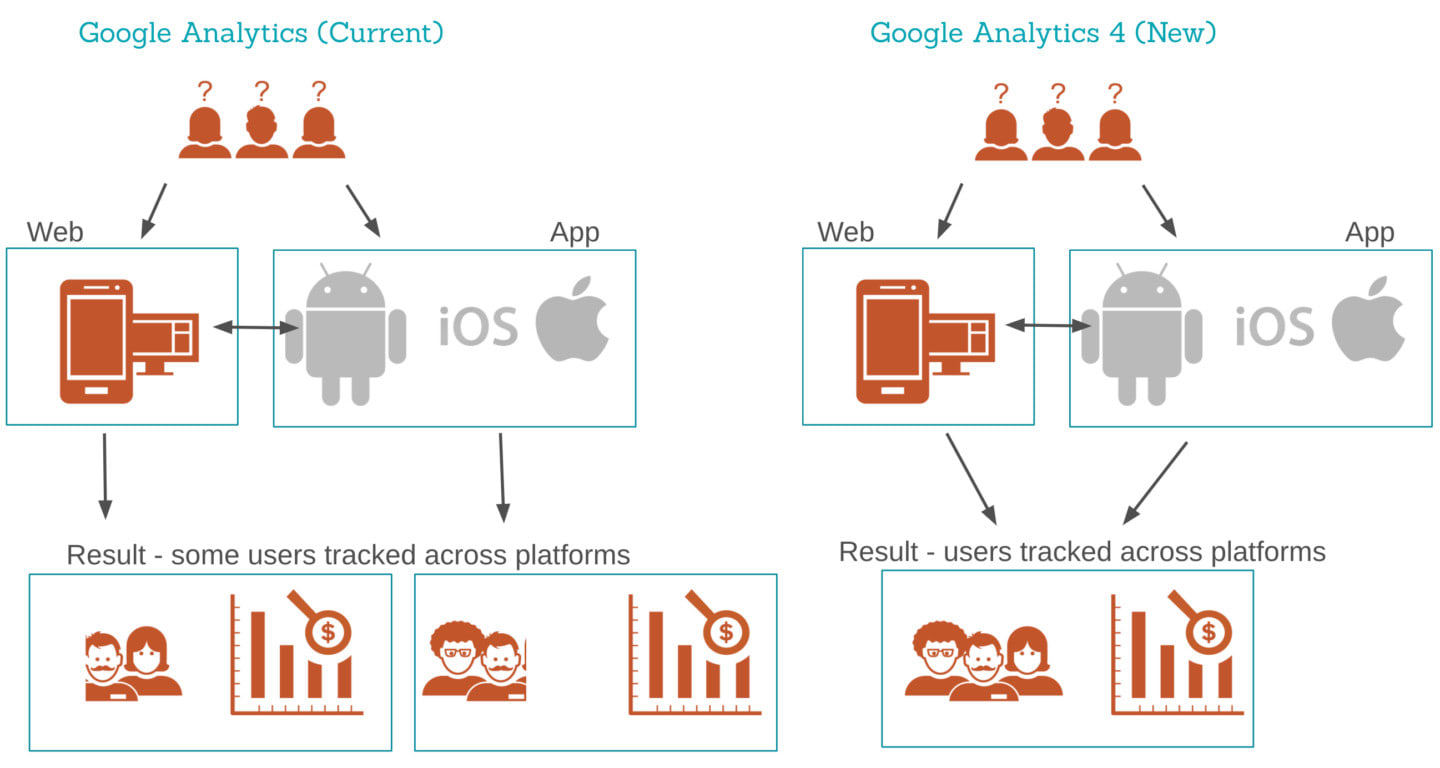
Cross-platform
One of the key innovations is the ability to work with data streams. In this case, information is collected not only from the website, but also from the company’s mobile application. Further, the entire array is combined into a single stream. This allows you to track the behavior of the same user on different devices and platforms.
While Universal Analytics required the creation of several separate views for this task, Fourth Analytics combines everything in a single flow. This approach greatly simplifies the work of marketers, eliminating the need to customize categories, actions, and labels for each platform separately.
Cross-platform is achieved through the use of an event-based tracking model, which is implemented through the Analytics Firebase tool. This makes it possible to get a unified view of a user’s journey through different points of interaction with the brand.
In addition, it is possible to track user behavior on several devices (smartphone, computer, tablet, etc.) at once. In UA it was several different threads, which had to be compiled among themselves to get a complete picture.
User identification
If in UA identification was carried out using cookies and Client ID, the new version of the tool identifies users anonymously. This approach allows you to get a more accurate picture of behavior on the site.
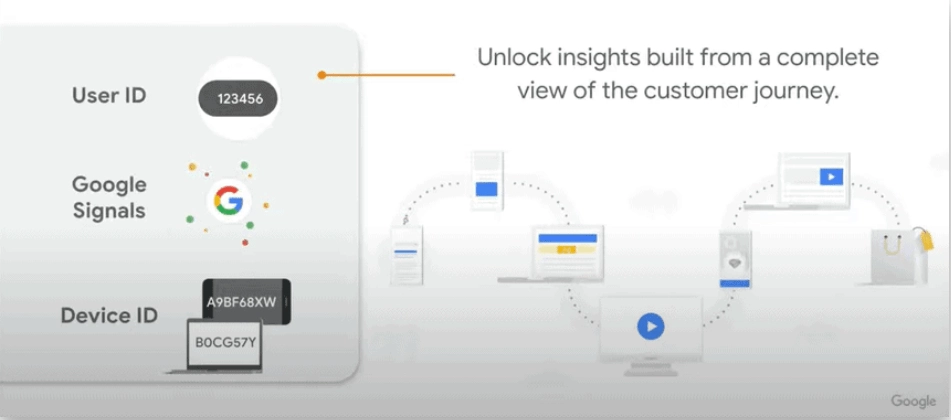
For this purpose, identification is applied in three steps:
- User_id. Each visitor is assigned a unique identifier assigned to his/her Google account. It allows you to track the user’s behavior across different devices and platforms.
- Google Signals It is a way to manage transactions and goal achievement. They are communicated through a special identifier and helps to link actions across different devices and platforms.
- Device_id. An individual advertising identifier assigned to a specific device. It allows you to track activity at the device level.
The problem with the previous approach was that in order to collect data, the user had to be logged in to their account. But before logging into the account, visits were not recorded and were not included in the report. That is, one person before logging in with a username and password and after was treated as two different individuals.
Thus, in Google Analytics 4 you can get a more accurate picture of user behavior regardless of whether they are logged in or use different devices. The main difference is that the system counts real people, not sessions or devices.
Machine learning
The big difference between GA 4 and Universal Analytics is that the new version of the system can predict behavior based on historical data. The advanced algorithms in Analytics 4 work in real time, analyzing actual changes and applying machine learning (ML) and natural language processing (NLP).
The system provides hints right in the interface, identifying important trends in statistics. Such tips and forecasts help marketers make more informed decisions about investing in RC and calculate ROI with a small margin of error.
Once the system collects a sufficient amount of information for analysis, it will begin to produce hints that indicate anomalies or warn of existing trends.
Thus, machine learning can:
- Predict the probability of conversion. Based on this, artificial intelligence can automatically create new audiences for Google Ads.
- Predict the likelihood of customer churn. Allows you to plan in advance to retain them. This is especially effective for businesses operating on a subscription model or with high LTV.
- Identify anomalies. These can be sudden changes in traffic, conversions, or other key metrics.
This significantly reduces the time and effort spent by marketers by automating a number of workflows. It is obvious that Google will continue to develop machine learning capabilities in its products, as this is an extremely promising area with huge potential.
Predictions of future conversions
The platform processes the collected statistics and identifies specific groups of the target audience, taking into account the probability of conversion. At the same time, machine learning algorithms analyze behavior patterns and, based on the collected data, can predict which visitors are most likely to perform a target action (purchase, registration, subscription, etc.) in the future.
Among other things, the platform can determine the likelihood of audience churn or predict the number of sales. For example, you can create audiences based on the service’s predictions and use them to run targeted advertising, surveys or remarketing.
This allows you to focus your marketing efforts on users with the highest probability of conversion, which in turn increases the effectiveness of advertising campaigns and the money invested in them.
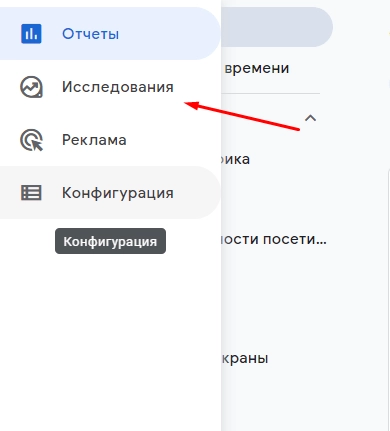
The function is accessed via the “Research” tab in the left corner of the screen:
More opportunities for eCommerce
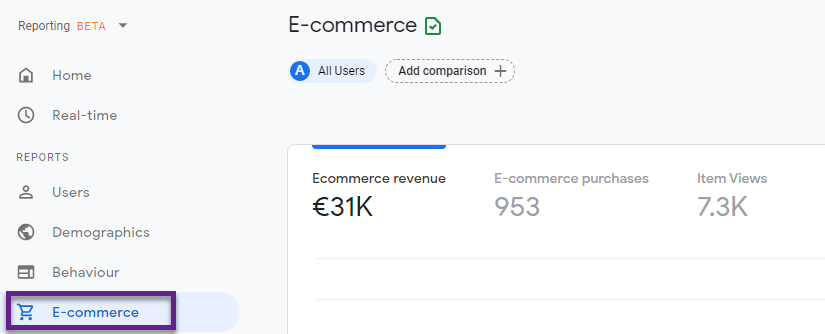
One of the key changes in the fourth Analytics is the unification of the e-commerce module. It is now unified for all resources. This means you can track and analyze information about transactions and user behavior in a single interface, regardless of platform.
Although the counters do not directly recognize purchases on the site, through the use of custom parameters these transactions can be tracked through separate events. This allows you to control every stage of the funnel, from browsing products to making a purchase.
In addition, GA4 includes new reports specially designed for online stores:
- A separate product report. It shows the performance of each product – views, additions to cart, purchases and revenue. In this way you can identify sales leaders and outsiders that need to be optimized.
- Sales funnel report. Visualizes the path from the first acquaintance with the product to the order, showing the number of visitors at each stage and the conversion rate. This helps to identify bottlenecks in the process and optimize it.
Integration with third-party services
You can synchronize the analytics tool with:
- Google Ads. This way you can see a direct connection between advertising channels and conversions, which allows you to evaluate the effectiveness of each traffic source separately and optimize budgets based on real results.
- BigQuery. Earlier export of statistics to BigQuery was available only in the paid version of Analytics 360. With the transition to the new version, export can be performed free of charge and in daily mode. In this way, you can perform deeper analysis and integrate the analytical information into CRM, for example.
- YouTube. Now you can evaluate the effectiveness of video ads within 3 days after viewing, which allows, for example, to create retargeting audiences from those who interacted with your video.
In addition to the above tools, you can also connect other Google services: Search Console, Video 360, Optimize, etc.
Interface
Compared to Universal Analytics, the interface has undergone significant changes, becoming more modern and user-friendly. One of the important differences is the reduction in the number of reports in the menu.
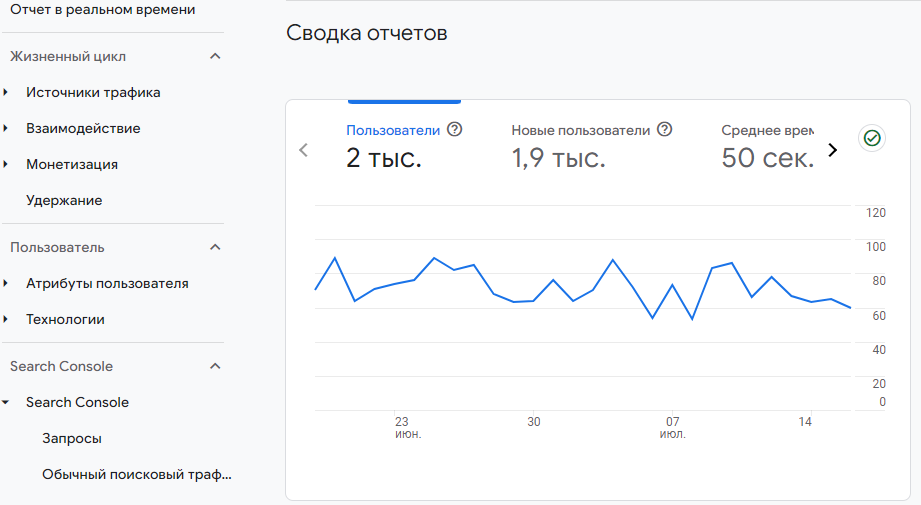
Some indicators were removed or replaced with new ones. This approach made the interface more manageable and easy to work with. Instead of five main sections in the menu, there are now 4 of them:
- Traffic Sources. This section helps to evaluate the effectiveness of attracting traffic from different channels.
- Engagement. This is where you can track page views, events, conversions and engagement.
- Monetization. This presents stats on revenue, transactions, and e-commerce.
- Retention. Here you will find information about returning visitors, frequency and depth of interaction.
This structure reflects the full lifecycle of a visitor on a website.
Number of sessions
When tracking traffic on the same site through the new and old Analytics, the number of visits will not match. This is due to the fact that the calculation methodology has undergone some changes.
In Universal Analytics, a session is a period of time during which a user actively interacts with a resource. UA considers the session to be over and activates a new one in the following cases:
- The user has been inactive for half an hour.
- The next day came.
- Some campaign parameter (for example, utm_source or utm_campaign) is changed.
This often led to artificial overestimation of the number of sessions, especially if visitors come to a resource, then directly, then from contextual advertising, then from organics or interact with it for a long time (for example, at different times over several days).
In the new version of the analytics system, a session starts when a user enters the site or opens an application and includes all subsequent interactions. And it ends automatically and only after half an hour of inactivity. Changes to the campaign settings or the approach of midnight have no effect on the current visit.
This provides several advantages:
- You can get a more complete picture of the user’s journey.
- This helps to more accurately assess the effectiveness of different traffic sources, because the attribution of conversions is more accurate with this approach.
New metrics
- Interaction time. This metric has replaced the traditional “time on site”. If earlier the time was counted even when the user was not active, now only active interaction with the resource – clicks, form filling, scrolling, etc. – is included in the general statistics.
- Conversions. If in UA conversions were configured separately through goals, now you can define any event (e.g. purchase, registration, form filling) as a conversion.
- Interaction Sessions. This is a new metric that only counts visits that lasted at least 10 seconds and during which the customer either made a conversion or opened at least 2 pages. It helps filter out random or very short visits.
- Sessions with per-user interaction. Helps to understand how often people repeatedly return to the site or app. Brand loyalty can be tested in this way.
- Overall profit. It helps you evaluate your overall financial performance and understand which sources are generating the most revenue.
DebugView
This is a special mode that allows developers to quickly check and debug sent events. When DebugView is enabled, it only shows data from the device on which debug_mode is activated. This means that you can test sending parameters without distorting the overall statistics.
One of the main advantages of this mode is the ability to instantly check incoming events. If in UA for this you had to wait for hours for the data to arrive and only then start fixing problems, in the new version all information appears in real time.
What else is different between Google Analytics 4 and Universal Analytics?
In addition to the differences already mentioned, it is worth considering that this is not all that distinguishes Google Analytics 4 from Universal Analytics. In addition to this, you can name:
- Data storage limits. Previously, they were stored indefinitely, which made it possible to analyze long-term trends and compare current indicators with historical ones. Now the limit is set for a maximum of 14 months (a little over a year). Therefore, if you want to save history for a longer period of time, you will need to export it regularly.
- Lack of views. In UA it was possible to create up to 25 separate views for each resource, which allowed to restrict access to a part of statistics and apply various settings. Now views are not used. Instead, the system works with resources, accounts, and streams (data streams), which greatly simplifies the account structure.
- Tracking code lifespan. While in the past it was often necessary to modify the tracking code to add new parameters, it now lasts indefinitely, making the customization process much easier.
- Opting out of cookies. Due to stricter privacy regulations and the advent of GDPR, the use of cookies has lost its effectiveness. If a person refuses to have personal information collected about him, Analytica simply will not add him to the database. But this problem is solved in the updated version of the tool due to the new identification method.
- Removal of monthly traffic limits. Previously, the monthly limit was set at 10 million hits (accesses to the server). If the traffic was much higher, you had to either pay for a premium version or accept the fact that some hits would be lost. Now this limit has been removed.
- A new approach to the bounce rate. Previously, it was calculated as the percentage of sessions in which a user viewed only one page and left without any other actions. Now the indicator has been replaced by the “engagement rate” – the percentage of visits during which an active interaction was recorded.
- Sales funnel analysis. Previously, it was only available in the paid Google Analytics 360. With the advent of the fourth generation of the analytics system, the function is available completely free of charge. This way you can identify bottlenecks in the funnel and optimize the process.
What are the advantages of GA4 over Universal Analytics?
The differences between Universal Analytics and GA 4 are primarily formed by the advantages of the latter and there are quite a few of them:
- More accurate statistics. Additionally, you can track internal site search, outbound clicks or scroll depth. This allows you to get a better understanding of the behavioral factors of a web resource and identify areas for optimization.
- Cross-platform and multi-channel attribution. All statistics from social networks, organic search, and direct traffic are combined into a single database, which makes it possible to analyze interactions on different platforms and get a more holistic picture.
- User identification across devices. Algorithms are able to accurately recognize unique visitors, even if they change login devices frequently. This gives a more accurate picture of the real audience and helps personalize dry numbers.
- Audience Comparison. For example, you can compare how those who came from social media behave with those who were attracted from organics. Or how conversions differ between new and returning visitors.
- Intelligent reporting and forecasting. Uses machine learning to automatically identify significant trends and anomalies, while the forecasting function helps predict future results based on previous history. This enables you to make proactive decisions and respond to changes faster.
- Integration with Google Ads. Allows you to view the statistics of advertising campaigns directly in the interface. This makes it easier to analyze advertising effectiveness and optimize campaigns based on real data.
- Improved privacy. The platform does not use cookies and anonymizes IP addresses by default, with no option to disable this feature. This helps to comply with GDPR and other regulatory requirements.
What are the disadvantages of Google Analytics 4 compared to the old version?
- Difficulties in migration. This is especially true for traffic web resources with a large historical base. Unfortunately, previously collected visit data cannot be automatically imported into GA4 due to fundamental differences in information collection models. To mitigate this transition, it is better to start using both tools in parallel as early as possible.
- Delays in executing complex requests. In GA4 their execution can take up to 72 hours. This is due to the fact that a new information processing architecture is used here, which is designed for scaling but works slower.
- Fewer built-in reports. Many of your familiar sections have now disappeared from the menu altogether or changed format. Thus, it will take some time to adapt or find alternatives. For example, Looker Studio can be used to get all the usual reporting.