
Hi everyone, my name is Yana Lyashenko, I am a Google logistician. I’m in charge of delivering targeted audience to businesses with the right parameters. Helping you scale your online sales with the same AI-powered tools of Google ads.
Announcement of the case study that will be discussed in the video
In today’s video, I’m going to show you a recent team case study. I would call it: it was a big gap in my life because in this project, the product is different from similar large clients of the same type. We have a very prefabricated village of everything here. We have products for the home, for the kitchen, for cars. In short, we have a lot of stuff on our site. It may be different for some products than the cases that we have on there for a large number, hundreds of sales. I think we’ll get this client to hundreds of sales a day, from hundreds of sales a day. But this particular account is the one that we’re having a lot of trouble with. What’s the problem? I think there are several overlapping factors, which I will discuss below.
Look, I’m not going to show you all the nuances of setting up an ad campaign, its structure, products, bidding strategies, and so on. Let’s be honest, right? I realize that some people don’t like it when I just show a case, brag about it, tell something vague. Let’s put it this way: those who are competent in what I say will hear it anyway, but to tell, to give a ready-made spreadsheet – sorry, please, that’s our time, the team, all the people who work on it, the client’s money and time, his patience and so on. Our nerves, because I’m really going gray soon with this Google thing.
The start of a client’s ad campaign
Here I’m showing a period that’s a little bit longer than the period when we started support, our support started on the 20th. I’m looking at the CRM, this is August 28th, 27th or so. That’s about that time period. I’m going to reload the page so you can make sure the numbers here aren’t fake. Because it tells us, for example, that we’re changing the average CPC. They also tell us that someone is writing or drawing or whatever else is going on. If we switch to a campaign, the numbers are the same.
That’s why I called this case “The Big Gap in My Life.” Because it was incredibly difficult. This period of time where we’ve stabilized – I’m not sure until the end that it’s going to be amazing, because there’s really a lot of challenges. There’s not a lot of budget. There are not a lot of products. In fact, many trials have been done. Some of them are effective, some of them are not.
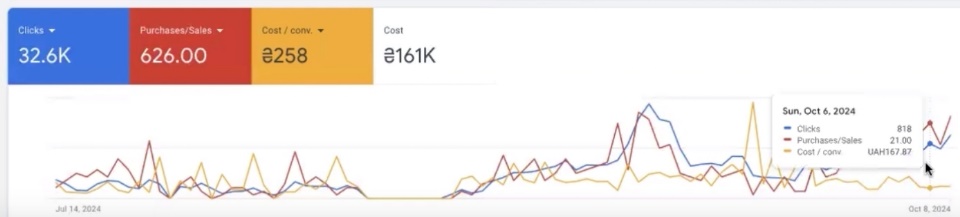
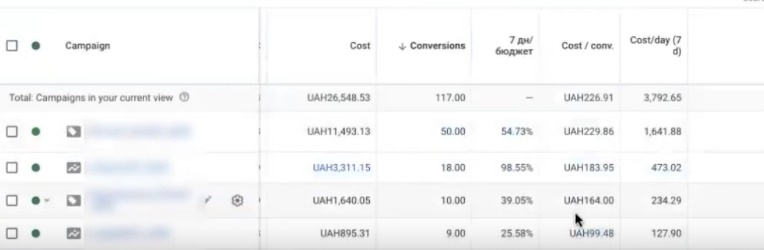
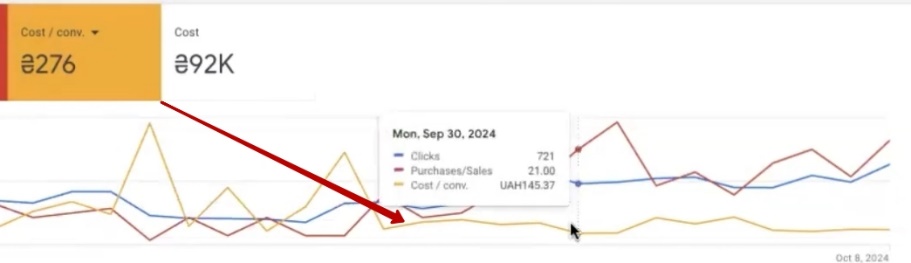
Here you can see not very good figures – 50-60 UAH per sale. But there is an opportunity to go up to 21, and the price per conversion will be more expensive. We are going up, so to speak. I hope that this dynamic will continue, because there were really, like, a lot of sales, but the price per conversion is quite expensive. And that was the most problematic part. Once we started…
How to scale performances?
Remember in one of my articles I talked about how scaling a performance should be uncomplicated and fairly simple. Because you either accumulate useful analytics and then start increasing budgets. Or you immediately teach performances to work at certain limited rates. Here we have profitability and cost per conversion respectively. They are intertwined across segments, product types and so on. They’re all personalized, they’re all different.
The problem with getting a stable price per conversion
So what do we have here? What’s the problem here? It was very difficult to get a stable price per conversion. I mean, you can see that even before the period of support, here you can see that it is not realistic, not adequate. You can see what kind of breakthroughs in the price per conversion. It seems to be the same, the product mix is the same, we’re scrolling the same. Everything seems to be okay. And it works differently somehow. It’s the same here. Watch this. Out, seems to be stabilizing, seems to be doing fine. 129 UAH, 20.88 of these conversions.
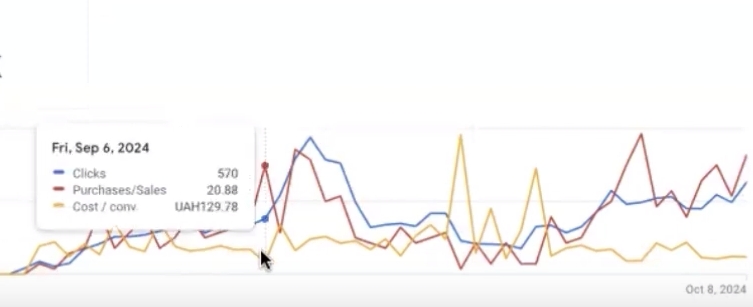
Here, the price per conversion shoots through and then the performances just start to fade. The withering is when they gain momentum and then just fall.
Let’s put it this way, the part here was the company did slash the budget because it’s still very expensive. The prices per conversion are going up and the price per conversion has a direct correlation. This is not OK, given that we know the niche topics, it should be much lower. Then, when we start to trim them, leave some more or less effective tests, which also need to be optimized in the price for conversions – they stagnate in displays. This period of time, here it is, you see – this is the abyss in my life – it was very difficult to do something with these performances that they just went into shows.
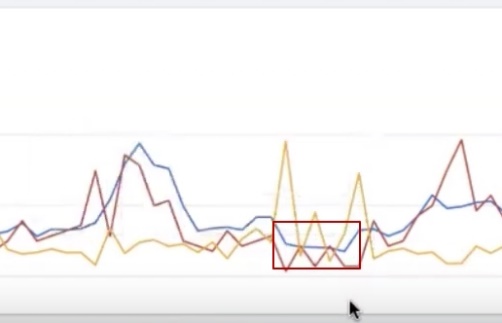
I realize that there may have been overlapping Google’s own redesigns here on September 20th. All the bugs that were there. There were inadequate budget drains. Not in this account, but across accounts, if you look. See, there’s 1,500 here. Could be anything. It could all just be overlapping. But, alternatively, we also failed to stabilize the price per conversion here and, thank goodness, at least we’ve started to have a breakthrough here.
Difficulty in conducting tests
What is the main problem here? It’s that there are a lot of tests being done. Really objectively, there is a lot of testing going on here. Here even what you see is very big analytics, here even the conversion rates have become a little bit better. So I’m showing you the overall dynamics in effective/ineffective periods.

These all tests are incredibly complex. The difficulty of them is that on big budgets you can’t afford it, because an objective system would overspend and not produce results. Tests of different variances don’t produce results either. Enough has been done here for this budget, for this product, for these KPIs – it is quite a large number of tests. That is why different structures, different combinations have been tested here. A lot of things were tested in order to simply achieve some result.
The result of the work done.
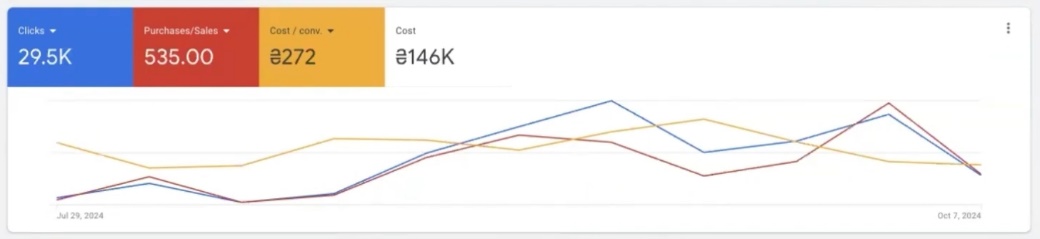
What kind of picture do we get? At the moment, give or take, there is still a relatively unstable structure in performance art. It is temporary. We are now going to try to equalize the result we achieved in terms of conversions. Because if you look here, we have objectively more traffic here and fewer conversions. And here the traffic seems to have a fairly good correlation.
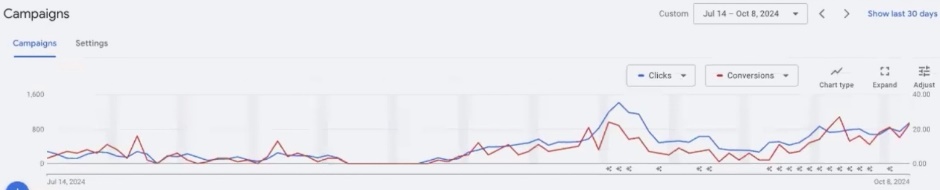
That is, it goes plus or minus evenly, which means that the conversion rate is quite good. That is, finally, we have found a conversion rate that is relatively good. You can see here – the conversion rate was quite good against the background of a small number of clicks during the period when the client was being supported, but there the price per conversion also shot up at the expense of costs. That is, the price per click was more expensive there, the costs were higher.
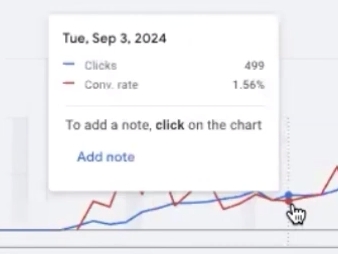
Here we also have the conversion rate. Yes, it’s skirting 1.56%. That’s the minimum you can afford. And conversions here, there were kind of more of them here, but the conversion rate has really swam, and it’s finally starting to relatively level off for us. It’s stabilizing in some of these limits/frames, which I’m quite happy about. I hope that we will further consolidate this result and go to scale, because it is important to find a fulcrum in the advertising account.
Distribution of goods in an advertising campaign
The fulcrum in our context is now quite a very combined structure, which consists, firstly, of partly advertising campaigns in my quadrant of product distribution. This is a classic SWOT analysis, perhaps you studied it in management when you were in higher education. In management, as a rule, there is a SWOT-analysis: these are dead dogs, cash cows, stars, and in my case, these are zeros (the last extreme category). It’s a division like that. I even have one campaign called “Dogs”, as weird as it sounds, but “dogs” are doing pretty good still. So it’s not always the products that are super expensive that are super critical….. In previous tests, they were super expensive because they wouldn’t be called dogs, they weren’t giving back much result at all because they weren’t giving conversions. They are now in the top across the account, in the top three ad campaigns that give conversions.
The second variant of the product split
And the second combined structure is a little bit differently we have a raked history. There is also such a division of goods as the same bestsellers, midtails and longtails. They are divided according to the number of conversions over certain periods, by some other indirect indicators. So it’s such a relatively floating story, just like dogs and the other story. Right now, it’s a combined sort of structure that remains.
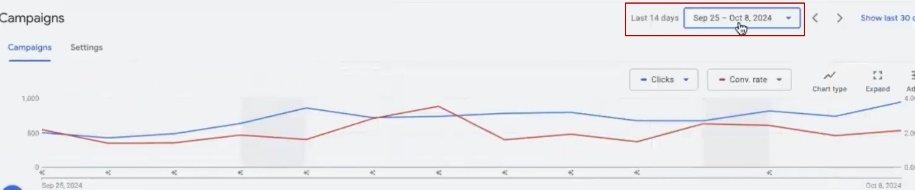
Improvement in the last 14 days
If you look at the last 14 days – things are improving significantly It looks pretty expensive. I agree, because I’m taking 14 days. A lot of tests are still left here, a lot of tests, maybe now we will completely exclude.
Even on the same dogs, the price per conversion has gone down a little bit, on longtails as well. Although there are not enough conversions. We have a top advertising campaign, it is quite expensive, and we must also try to stabilize it. But this whole analytics is drawn out against the background of this incredible number of tests that were here.
The 30-day purchase rate
So we have 333 conversions in 30 days. All these conversions are purchases, purchases. Now you can do a layout there just I have a lot of conversions still micro conversions that we don’t use. This is buying, here it is buying, buying, buying, buying.
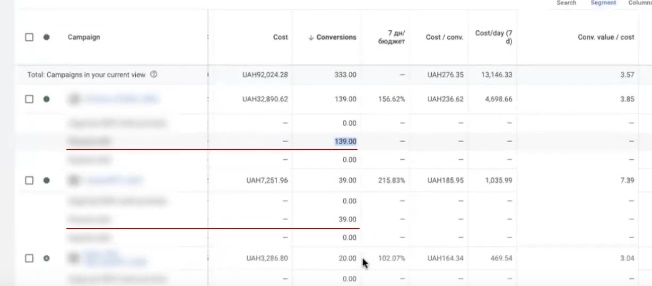
And here you can at the very end unbelievers here is the purchase, all these conversions, they are all purchases. That is, it’s nothing invented, it’s not refined, it’s not redesigned, something like that.

We just use microconversions not for optimization, but for (this is, for example, add_to_cart that one) evaluation of the criteria of incoming, threshold quality of traffic. When we have traffic coming in and we don’t see conversions. They help to evaluate more adequately the timelag between the date of the click and the date of the conversion that we get. That’s what it’s used for, more for analytics.
What’s the problem with “the abyss”
There’s a lot of tests. Perhaps the problem is that we could not get through this gap in any way, and it was very unstable and non-standard. Perhaps the problem with this gap is that it is the number of these tests that is the problem. Because the approach that was used here is more suitable for large projects that have hundreds of sales per day. And here it is less. Perhaps it was also this nuance, because, after all, the structure that is used, even though it was launched one by one, it was optimized and so on. But still there are these boundaries that are more suitable for large projects and not for small projects. Because in large projects it is also not easy – you increase the budget once or twice and it scales up. There is also eating up profitability, there are also products with the wrong structure, there are also products that are completely non-functional, that are functional and so on.
Conclusions
It’s a very interesting project, it’s really very complex in terms of all these tests, performance is very unresponsive to this whole picture. It’s just an incredible amount of analysis. In terms of the history of changes, there seems to be so few of these changes at all. You could make more of them, and there is nothing to make them on, no analytics that would allow you to change things faster. I mean, how can you tell? It’s combined with technical tests, with remarketing conversion test, with conversion conversion test, attribution model testing, windowing of those conversions, structure and stuff like that. So the result of it starting to level off a little bit is the result of this whole combined story. You can call it a mess, in fact, it’s a bunch of tests that have been merged. Now we are looking at this picture in general, but we can really see that this band is orange for conversion, it is not for three days, but for more and has a downward trend. Which makes me very happy.
Even if I take the first one now and just take a week to see the dynamics. Realistically this cost per conversion – it’s been so difficult for her. I mean, it’s like you build up conversions, and they’re a direct cost correlation, Google was spending more and more.
I think it’s all one on top of the other, these all the AI changes, all these changes that Google is making, their bugs. They need to make sure that they keep qualified people on their payroll, not just one or two, you don’t want it, go quit. They used to chase these personnel, but now they treat them indirectly. Maybe they have the code for this AIshka being written by that Gemini of theirs. I don’t know, Gemini/Gemini, what anyone calls it. I have no idea. But realistically sometimes you have to plow into some small account that doesn’t have a lot of those sales, but realistically sometimes it feels like an incredible amount of work.
I mean, it’s not just launching one RCS and it’s rolling. It’s a client coming in with a few RKs. We start August 27-28th. The client came in with some not-so-cool results. You can see here, for example.
From the reviews on your YouTube you can write me this is coincidence, this is seasonality, or something like that. Even if it is seasonal. Battery bulbs aren’t as cool now as they were during the shelling season. So, guys, it doesn’t work here. There’s no generators here either. It’s really just the result of a lot of work by the people who have been working here. It’s a lot of work just bluntly analyzed. It’s all the results of the hard work of specialists.
This is such a self-glorifying case study. Some may like it, some may not, but I’ll proudly post it on my YouTube channel. Let it be.