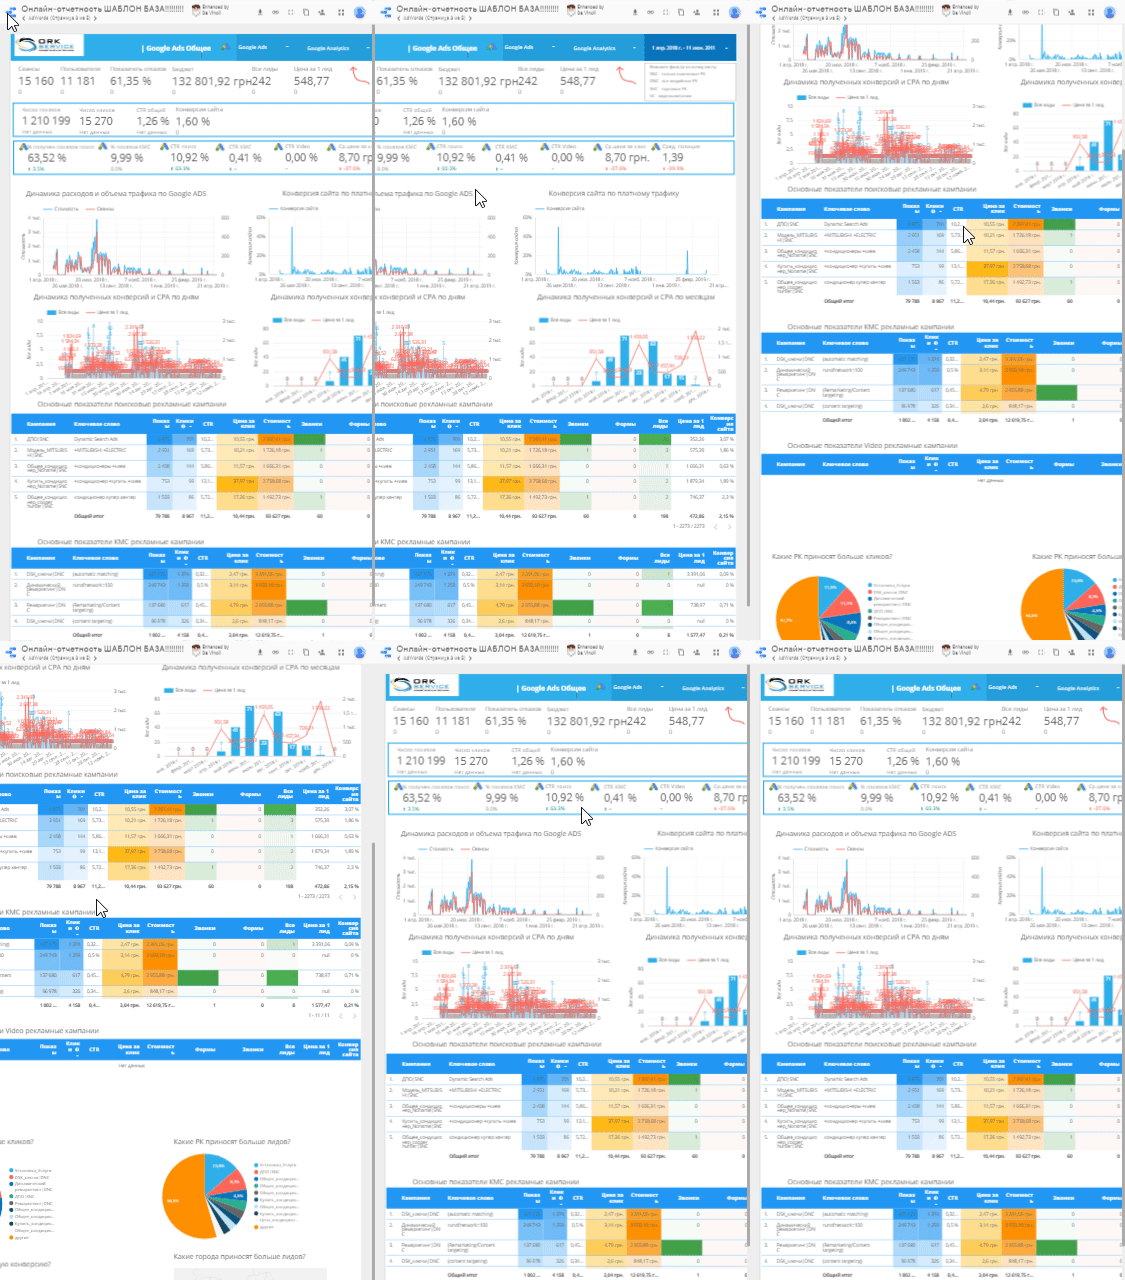
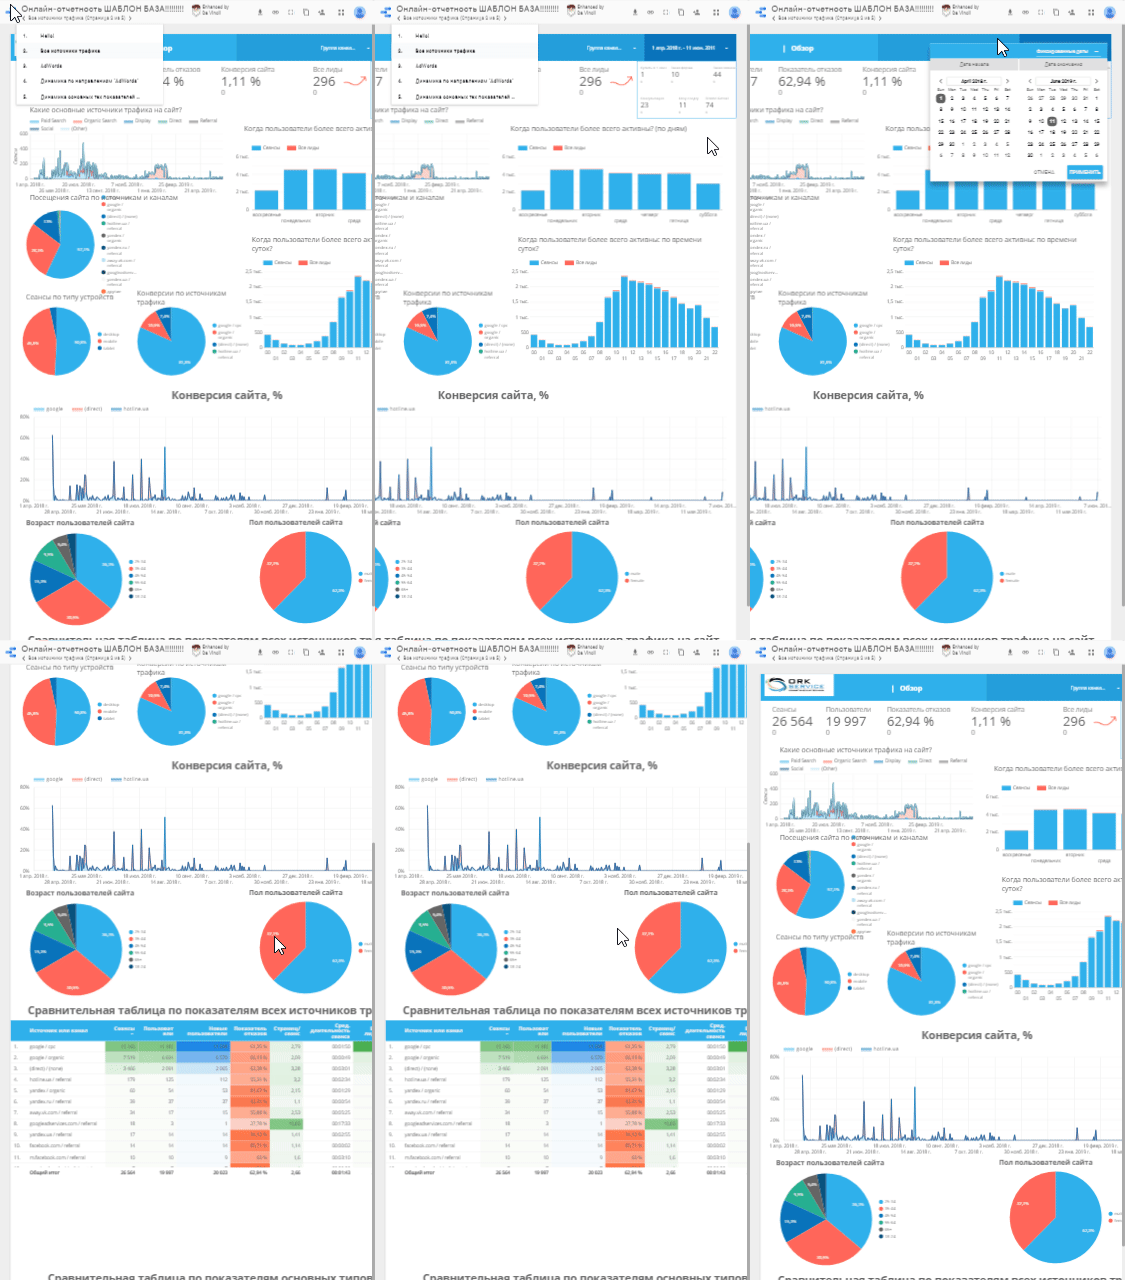
Setting up 24/7 reporting: examples of reports on control points
The purpose of Data Studio 24/7 reporting is to have the main indicators of your business and advertising results available for analysis 24/7/365 both on your PC and on your mobile phone.
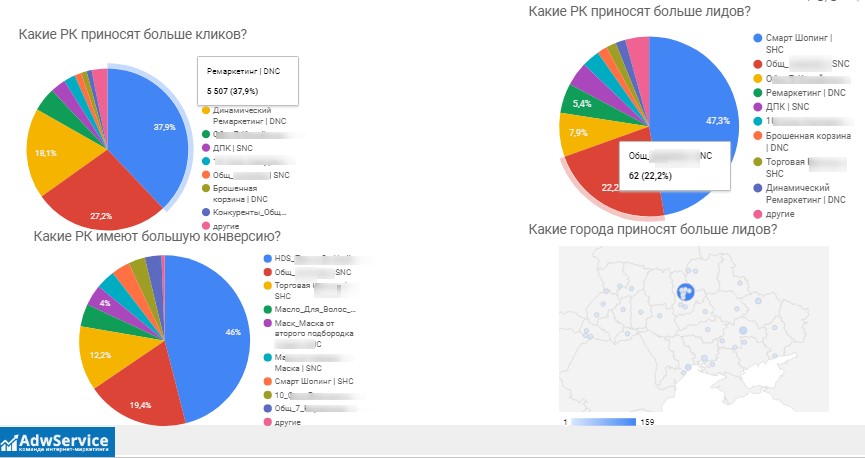
Data is pulled from Google Analytics into a Data Studio report specially created for you, where in a convenient format in the form of tables, graphs and charts you can see all the data on your project, in the context of any period of time (by selecting a date in the filter). In practice, we provide access to 24/7 Data Studio reporting as a link in the browser.
How many calls and sales will I get by ordering contextual advertising from you?
I need to calculate the conversion of my website
Describe
the task
in the application
Calculate potential ad revenue
Google
contextual advertising calculator
How reports are provided


What we need to consider when setting up 24/7 reporting and its maintenance:
Strengths:
You can see all the main KPIs for the project in one place in the context of keywords, campaigns, what share of paid advertising was in the final result.
Weaknesses of the tool:
Data is loaded with a delay of 1 day. Up-to-date data for yesterday and earlier is available today.
What is the benefit of round-the-clock reporting for business?
The ability to view the data of your project in a convenient format, “keep your finger on the pulse”: 24 hours a day, 7 days a week, 365 days a year. Reporting example: 


